

The rule set behind the portfolio, laid out in full below.
I buy shit companies cheap, with a reasonable chance they become less shitty. Tangible bargains, not stories. That’s the whole strategy. Everything else here is just the fine print. This page is the part where we show that fine print — the actual numbers behind “cheap,” “survives,” and “time to sell,” so the rules governing the portfolio are exactly as public as the portfolio itself.
At a glance, before the detail:
Survival screen — leverage, liquidity, dilution, and the Piotroski F-Score veto all have to clear before a name reaches the matrix.
Cheapness matrix — P/TBV × normalized P/E sets a base tier (Big / Standard / Small / Watchlist); a shareholder-yield modifier and a capital-allocation check can each move it one notch.
Sizing follows the tier — roughly 1.0% / 0.5% / 0.25% of NAV, not a flat default.
Selling uses a dynamic target — 0.80× current tangible book, cross-checked against the stock’s own ten-year trading range — plus immediate exits if the thesis breaks.
Diversification caps by country, sector, and correlated cluster; at least 80% of NAV stays below 1.00× P/TBV.
Two bounded exceptions — Quality and Growth Quality — each capped at 10% of NAV, for names above 1.00× P/TBV with real offsetting strength.
How a stock becomes a position
Before any of the mechanics below, here’s the shape of the whole process. We start from every stock tradeable through Interactive Brokers, run a custom screen for cheapness and survival, then underwrite what’s left one company at a time until it either earns a spot in the portfolio or doesn’t.
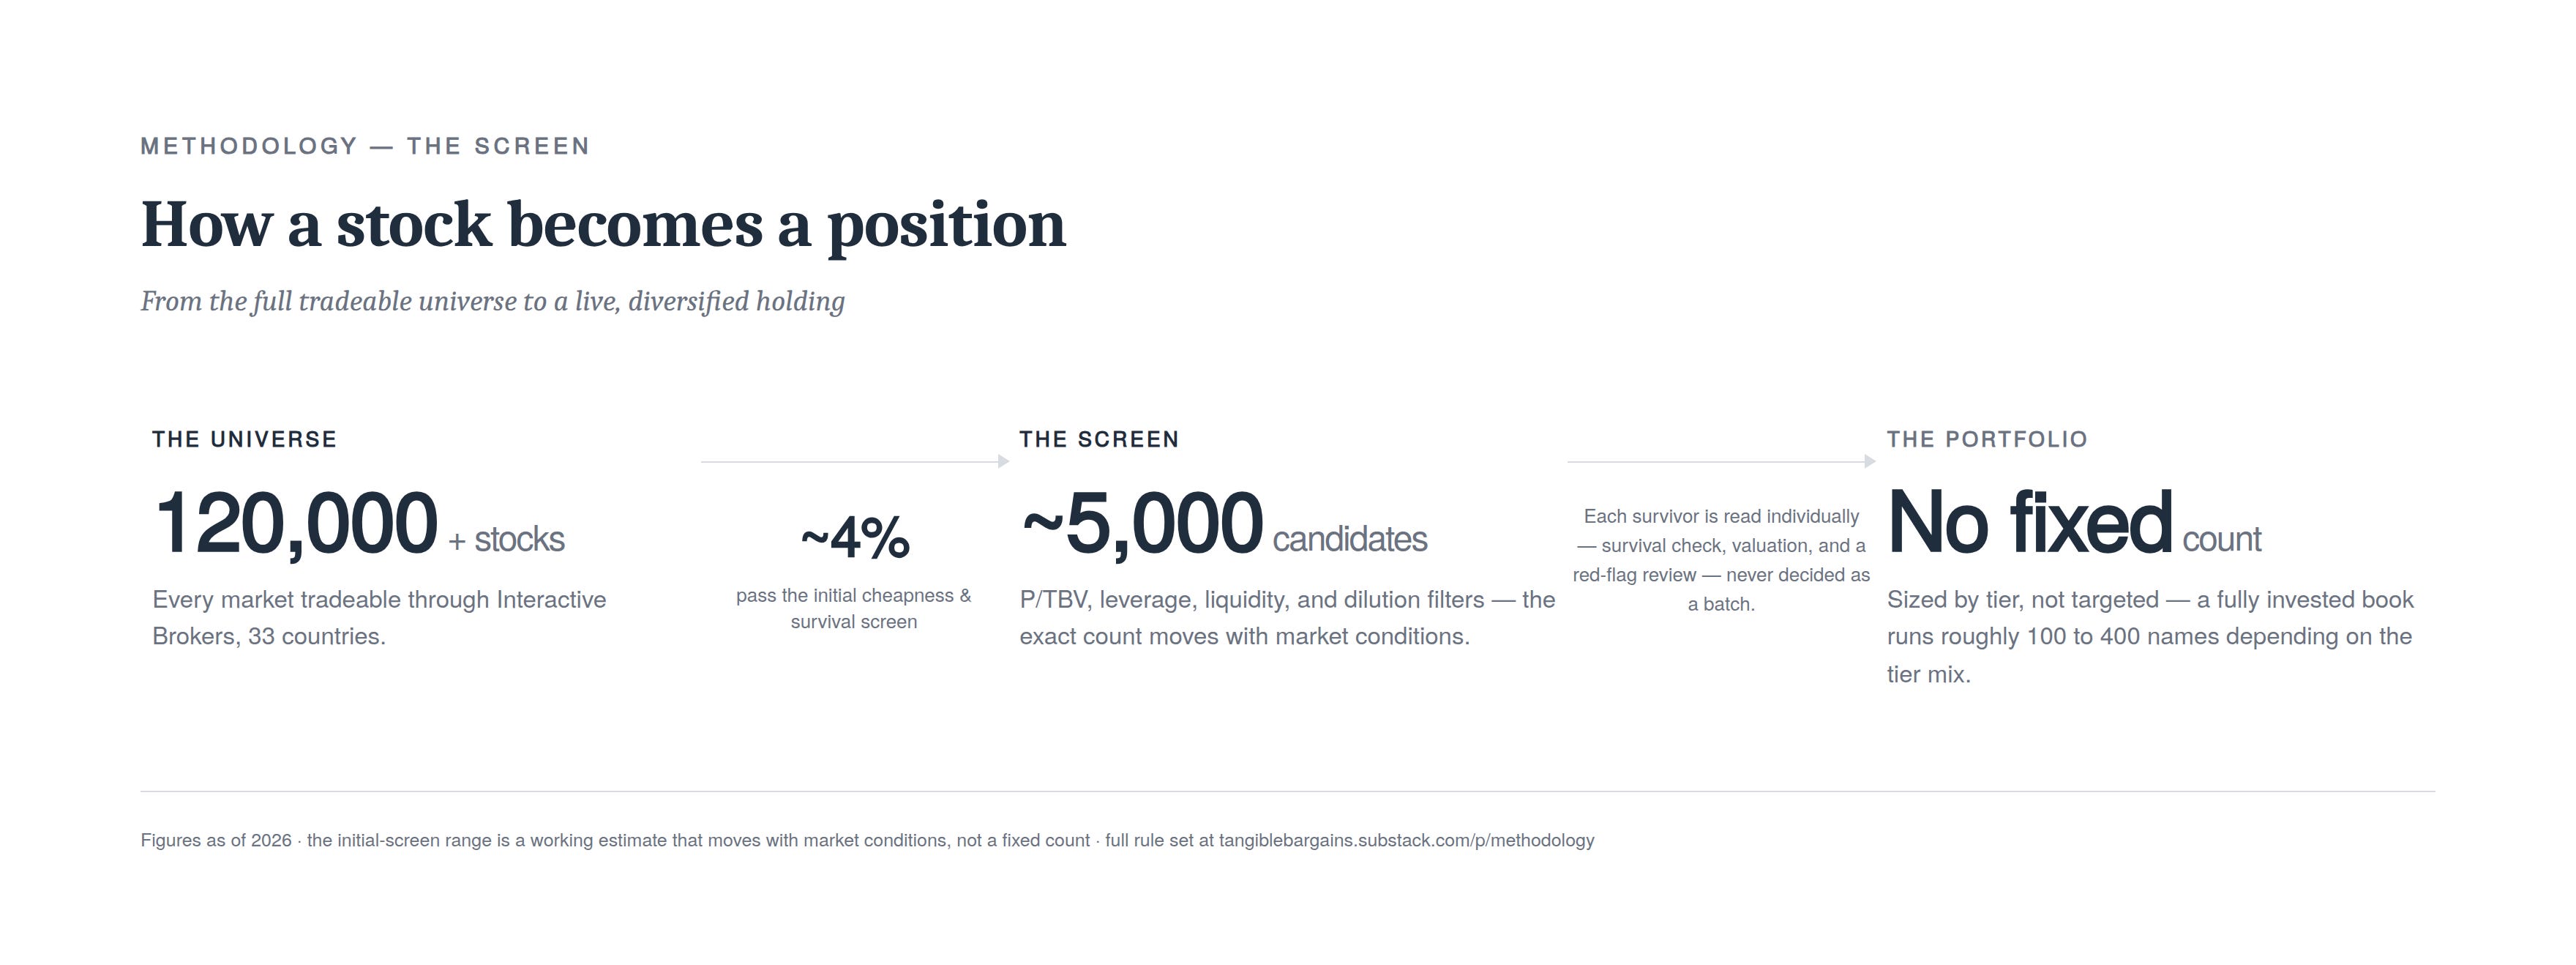
The universe — 120,000+ stocks across 33 countries, every market tradeable through Interactive Brokers.
The custom screen — an initial pass for cheapness and survival (P/TBV, leverage, liquidity, dilution) narrows that down to roughly 2,000–5,000 names depending on market conditions. Call it 2–4% of everything screened.
One by one — from that pool, I cherry-pick the names that earn a full individual underwrite: the F-Score veto, the Schloss Decision Framework (Steps A/B/C), a complete forensic write-up. No batch decisions past this point.
The portfolio — whatever clears all of that becomes a diversified, Schloss-adjacent basket, sized and capped by the rules on the rest of this page. No fixed position count; the basket is however big the bargains say it should be.
Cheapness isn’t one ratio — it’s a matrix
Every candidate that clears the survival screen below gets placed on a grid: tangible-book-value discount on one axis, normalized earnings multiple on the other. A deeper book-value discount can carry a worse earnings multiple, because the discount itself is doing the work. A shallower discount needs a genuinely good multiple to earn the same tier, because there’s less cushion to lean on.
The cheapness matrix (P/TBV by normalized P/E):
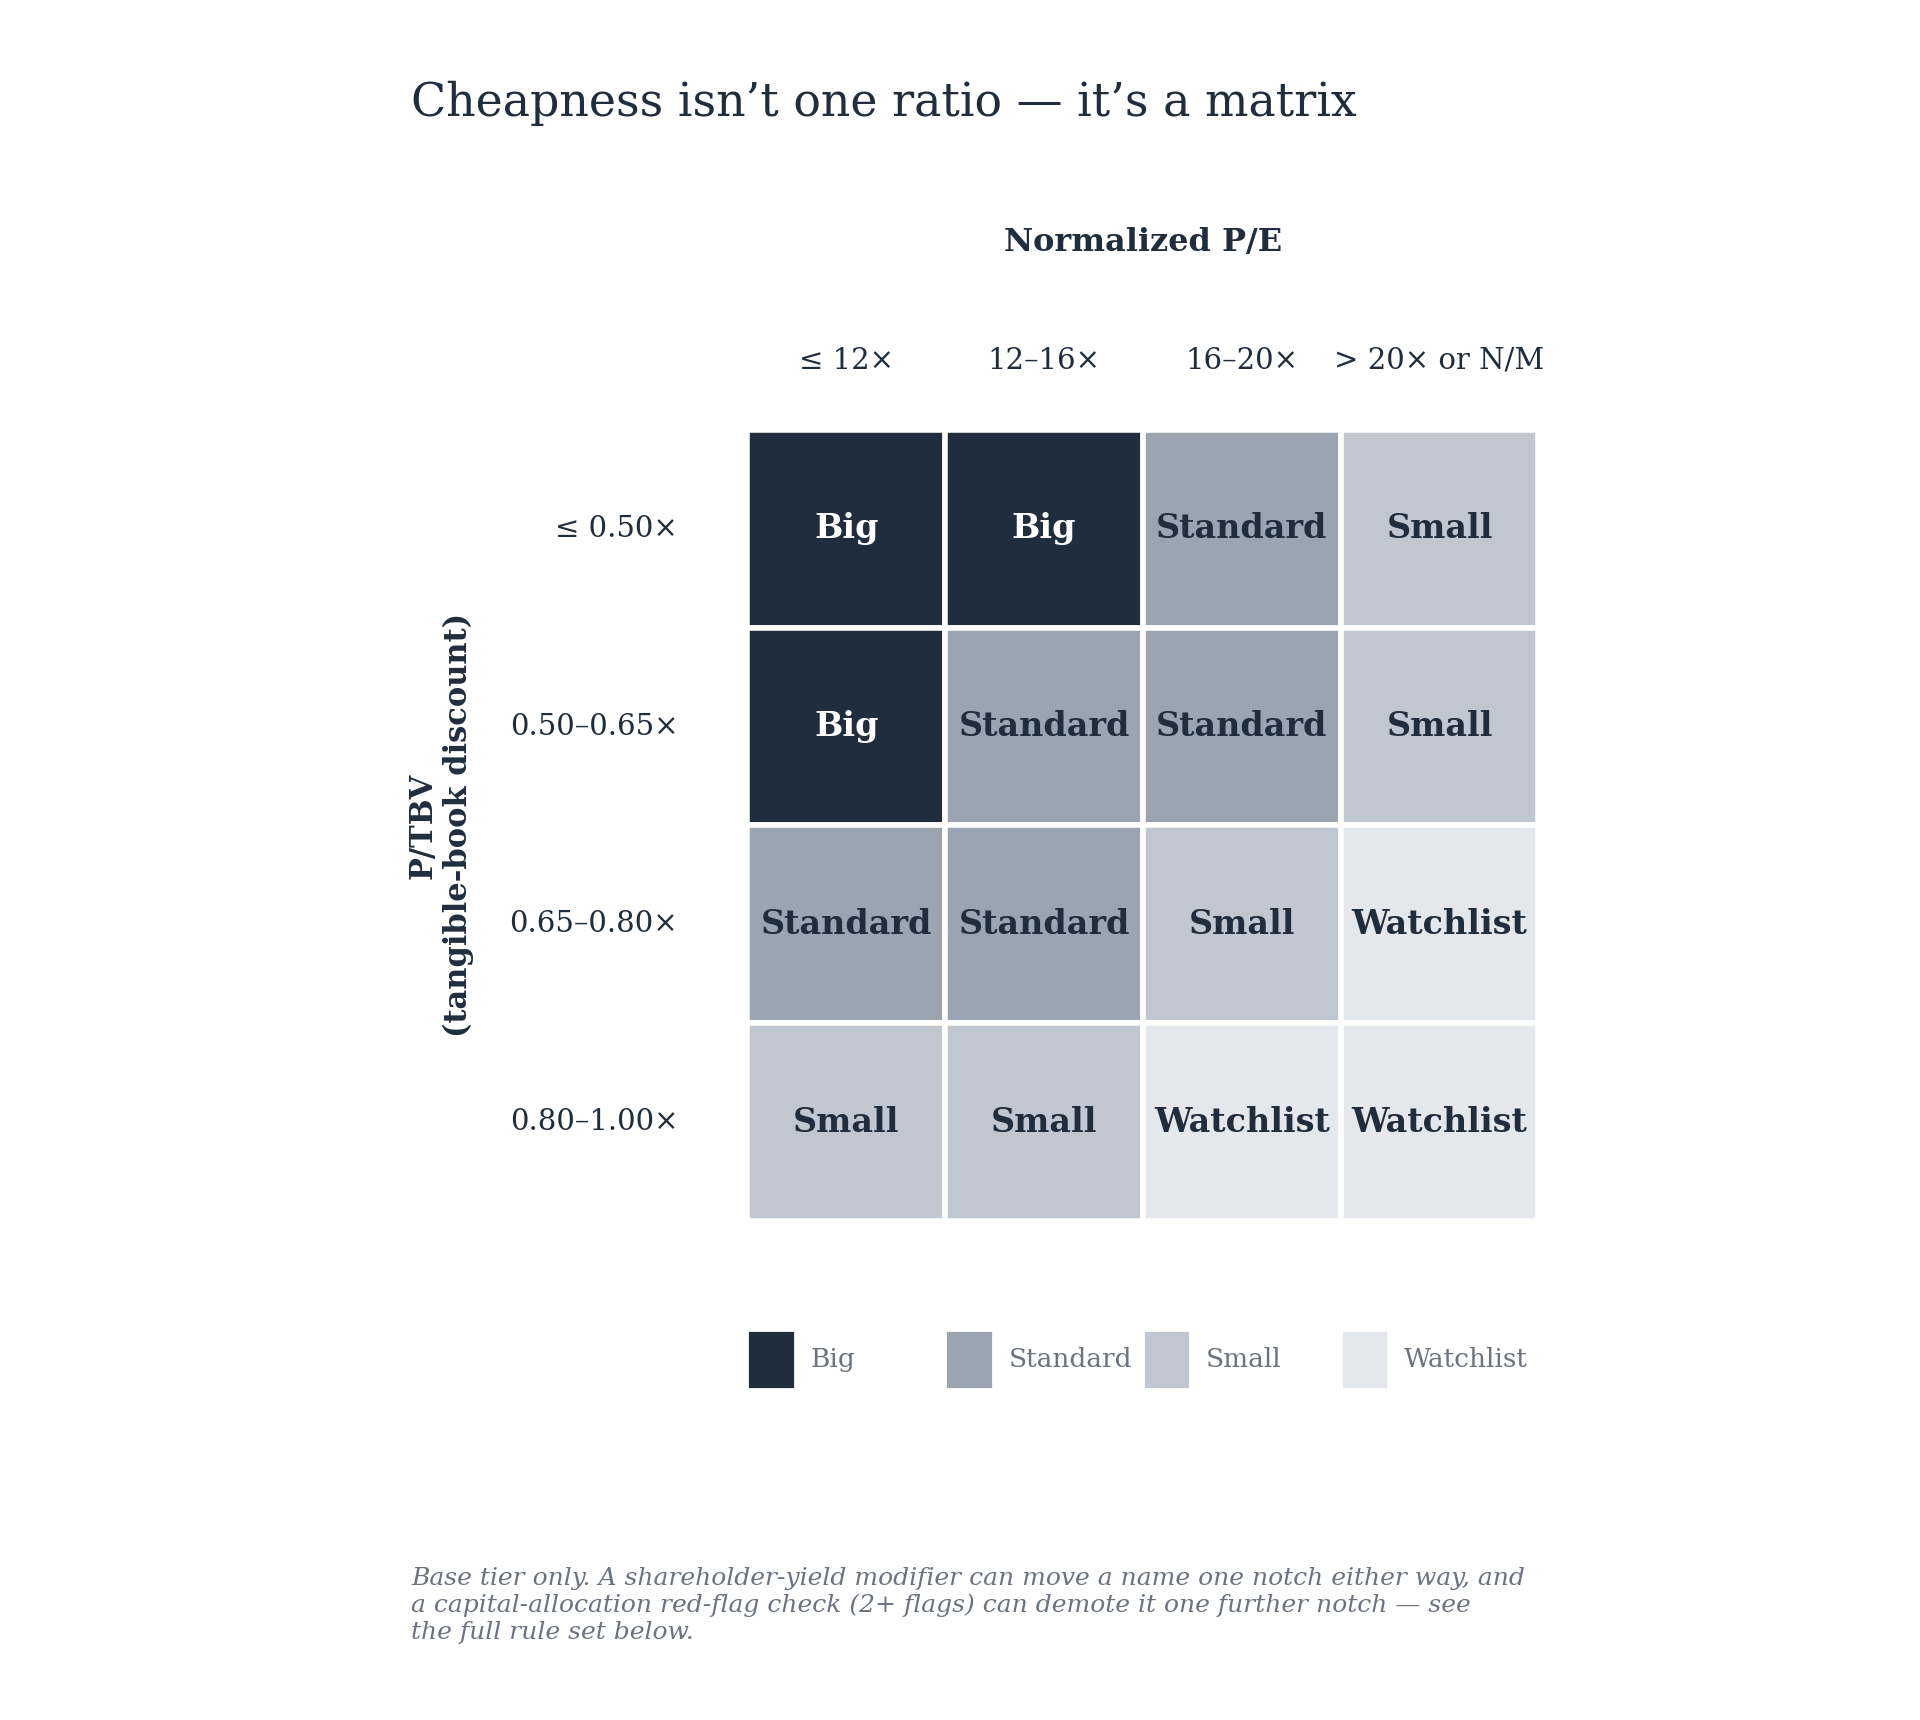
That grid cell — Big, Standard, or Small — is the base tier. A “not meaningful” P/E (negative, zero, or distorted by one-time items) is always treated as the worst column; we don’t invent a normalized figure to land a better cell. Watchlist means a name clears the survival screen but the matrix doesn’t support a buy at the current price — it stays on the list, not in the trash.
Then a shareholder-yield modifier moves it one notch, in either direction:
≥ 3.0% dividend + buyback yield: promote one tier (Small → Standard, Standard → Big; Big stays Big)
1.0%–3.0%: no change
< 1.0%, with strong free-cash-flow retention and no payout: no change — the capital’s being reinvested, not withheld
< 1.0%, with weak or negative free cash flow: demote one tier (Big → Standard, Standard → Small, Small → Watchlist)
And a capital-allocation check can demote it one more. Every candidate gets checked against a short list of red flags: controlling-shareholder or state ownership with no minority protection, capital routed to policy-driven rather than shareholder-return-driven projects, a dividend cut or suspension, management stonewalling direct capital-allocation questions, or officer pay/related-party deals priced off-market. Two or more of these firing downgrades the tier one full notch — and when that happens, the write-up says so explicitly: what the numbers alone supported, which flags fired, and that the downgrade is a policy call, not a hidden adjustment.
Sizing follows the tier — it isn’t a flat default
Position size is a function of where a name lands on the matrix above, not a single default percentage applied to everything:
Big — roughly 1.0% of NAV as a starting cost basis
Standard — roughly 0.5% of NAV
Small — roughly 0.25% of NAV
These are starting points, not a formula executed blindly — the final size is a discretionary call within that range, and existing positions that predate a re-tiering aren’t force-adjusted to match.
This also means we don’t target a position count. A basket built this way could land anywhere from a hundred names to several hundred, depending on how many bargains clear the bar at what tier in a given market — a heavier skew toward Small-tier names naturally means more of them. The count is whatever falls out of applying the same discipline consistently, not a number we’re managing toward.
Reviewing a position: proximity to what we think it’s worth, not a NAV ladder
We don’t run a separate schedule of price-based review triggers layered on top of the tier system. A position gets a fresh look as its price closes in on the sell target computed for that specific company (see “Selling” below) — that’s the actual test, because it’s the one number that’s already doing the work of saying what we think the stock is worth. A position that’s grown as a share of the portfolio but is still trading well below its computed target isn’t flagged just for being bigger; one closing in on that target gets reviewed regardless of how it got there.
Entry, restated: two checks, then the matrix
Before a name even reaches the matrix, it has to clear a survival screen — leverage and liquidity have to hold up, dilution has to be under control, and a financial-statement survival check (below) has to pass. Fail either and it’s an Avoid, full stop, no matter how cheap the ratio looks.
Buy-Below and Strong Buy prices aren’t a single lookup from the tier band, either. We start from the top of the tier the stock currently qualifies for, then cross-check that number against the stock’s own trailing 10-year trading range. If the tier-band price sits above anywhere the stock has actually traded — a controlling-shareholder overhang or a policy discount that’s persisted for a decade doesn’t just disappear because a screen says it should — we pull the price down toward the top of that demonstrated range instead, and say which number we used and why.
Every write-up states which denominator it used — P/B, P/TBV, P/Adjusted TBV, P/NCAV, or P/Adjusted NAV — explicitly. Calling P/B “P/TBV” quietly isn’t allowed here.
Adding to a position: the ratio, not the price
Comparing to the previous purchase price is the wrong test — it ignores the book-value denominator moving between purchases. An add requires all of the following:
Current P/TBV is at least 15% lower than the P/TBV at the last purchase in this name — cheaper on the ratio, not just cheaper on raw price.
The tangible book value used in that comparison hasn’t materially deteriorated (no more than ~10% erosion since the last purchase) — otherwise “cheaper P/TBV” can just be a shrinking denominator, not a real discount widening.
The survival screen still passes.
The tier-based sizing guidance above still leaves room.
We don’t average down because a line on a screen got cheaper. All four, every time.
Selling: a target that moves, cross-checked against the stock’s own history
The sell target isn’t a flat 0.80× applied identically to every company, held forever against the price paid at purchase.
The target moves with book value. It’s defined as 0.80× the most recently validated adjusted reference book value per share — not 0.80× the book value that existed on the day of purchase. Buy at $6 when TBV is $10 (0.60×, target $8); if a later impairment cuts TBV to $8, the target becomes $6.40. If TBV compounds to $11, the target becomes $8.80.
It’s cross-checked against the stock’s own trading history, and we use whichever number is more conservative. We pull the name’s trailing 10-year P/TBV history and compute the mean of the top quartile (75th–100th percentile) of that distribution — the Historical Ceiling Estimate. Then:
Sell target = the lower of (0.80 × current adjusted TBV) or the Historical Ceiling Estimate, floored at 0.50× current TBV so a chronically discounted name — a controlling-shareholder overhang, a policy-discounted state-owned enterprise — still eventually gets sold instead of held forever waiting for a multiple the market has never once paid.
A flat 0.80× target on a stock that hasn’t traded above 0.55× in ten years isn’t a “cheap enough to sell” signal — it’s a number with no evidentiary support. Using the lower anchor keeps the target honest to what the market has actually demonstrated it will pay for this stock. When ten years of history isn’t available, we fall back to the flat 0.80× rule and say so explicitly.
Thesis-break exits are immediate and independent of price: fraud, accounting failure, financing distress, destructive dilution, or the loss of the asset-value thesis itself. After roughly three years without meaningful convergence, a name gets a full re-underwrite — not necessarily a sale — so the portfolio doesn’t quietly become a museum of forgotten theses.
The Piotroski F-Score: a survival veto, not a quality filter
Rank the universe by F-Score and only buy the cleanest names, and this quietly mutates into conventional quality-value — which defeats the point of deliberately keeping exposure to businesses other investors dislike. So cheapness ranks the stocks; the F-Score only vetoes the ones most likely to die before the bargain matters.
F-Score 0–2: Hard reject, regardless of how cheap. Re-eligible only if a later filing shows improvement.
F-Score 3: Probation — eligible only with an extraordinary offsetting factor (net cash position, or a materially stronger burn-rate test on the NCAV/liquidation route), noted explicitly in the write-up.
F-Score 4–9: Eligible. The F-Score does not rank within this band — a 9 does not outrank a 5 trading at a meaningfully deeper discount. Cheapness (the matrix above) still drives the tier.
Most cheap companies clear a 4+. This screen exists to catch the ones actively bleeding out, not to push the strategy toward “quality.”
We patched four specific weaknesses in the standard F-Score formula on 2026-08-17, after checking the design against the academic record and the strongest critiques of it we could find, including one that argues the score has stopped working entirely. Full writeup: how the score works, the research behind it, what we changed and why, and an honest look at the case against it.
Diversification: country, sector, and cluster caps
A basket built this way can still secretly become one trade if too many names share a single non-diversifiable driver.
Single country — U.S.: ≤ 35% of NAV
Single country — any non-U.S.: ≤ 15% of NAV
Single sector: ≤ 25% of NAV
Single correlated cluster (judgment-tagged — e.g. “Chinese property developers,” “single-commodity producers,” “one regulatory regime’s SOEs”): ≤ 10% of NAV, reviewed monthly rather than enforced trade-by-trade
Sector means the broad classification, not the narrow one, on purpose. GICS-style sectors (Financials, Industrials, Basic Materials, Consumer Cyclicals, and so on — roughly a dozen buckets) rather than sub-industry categories. A narrower cap is easier to satisfy on paper while still ending up with real, correlated exposure — a book that’s “diversified” across five different sub-industries that are all just different flavors of Financials hasn’t actually diversified anything. The broad cap forces the concentration to show up if it’s there.
Breaches from an existing position aren’t force-trimmed — new cost-basis dollars simply stop flowing to that country/sector/cluster until it drifts back under the cap. Current standing against these caps shows on the Portfolio page, not repeated here, since it moves.
Portfolio-level valuation discipline: staying well under tangible book value in aggregate
Per-position rules keep individual names cheap. This is the check that keeps the portfolio cheap — because a basket can pass every per-position rule and still drift expensive in aggregate if the exception lanes (below) quietly grow into most of the book.
At least 80% of NAV stays in positions trading below 1.00× P/TBV. This isn’t a separate rule bolted on top — it falls directly out of two caps that are already in force: the Quality Exception is capped at 10% of NAV (see below), and the Growth Quality Exception carries the same 10% of NAV cap. Combined, the two lanes that are allowed to sit above 1.00× P/TBV can never exceed 20% of the portfolio — which means at least 80% is structurally required to stay below tangible book value, not just aspirationally. If either exception lane’s exposure grows to threaten that 20% combined ceiling, new cost-basis dollars stop flowing to that lane until it’s back under the cap — the same mechanism as the country/sector/cluster caps above, not a special case.
The practical effect: the portfolio’s NAV-weighted-average P/TBV stays comfortably below 1.00× at all times by construction, not because of a target being managed toward after the fact. Current standing against this ceiling shows on the Portfolio page.
The Quality Exception — a bounded lane above 1.00×
A stock above 1.00× P/TBV has no tangible-asset margin of safety, so the substitute has to come from somewhere else — earnings quality, balance sheet, and governance all have to be genuinely better, not just “the story is good.”
Eligibility — all of the following:
P/TBV between 1.00× and 1.20× (above 1.20×, it’s a different strategy — pass)
F-Score ≥ 7
Shareholder yield (dividend + buyback) ≥ 2%
Balance-sheet classification of Net Cash or Conservative
Moat classification Moderate or better
Governance Risk = Low (zero capital-allocation warnings)
Sizing follows the same discretionary, tier-equivalent approach as the matrix above — a strong pass sizes like Standard, a marginal pass sizes like Small — and aggregate Quality Exception exposure across the portfolio is capped at 10% of NAV. Seasoning, not drift.
Exit is calibrated differently, since these aren’t cigar butts: sell at 1.50× P/TBV, or when normalized P/E exceeds roughly 22×, or on any Governance Risk downgrade to Moderate or worse — whichever triggers first.
The Growth Quality Exception — a second, narrower lane
A separate carve-out for names between 1.00× and 1.50× P/TBV with real, demonstrated growth — not just a good story about future growth. Eligibility — all of the following:
ROIC/ROCE ≥ 12–15% sustained over 5+ years
Revenue CAGR ≥ 8–10% over the trailing 3–5 years
A credible reinvestment runway
Normalized P/E ≤ 20–22× (soft preference)
Zero capital-allocation warnings
A mandatory human-discretion flag — this exception is never auto-assigned; a person signs off
Aggregate Growth Quality Exception exposure is capped at 10% of NAV, the same ceiling as the Quality Exception above — for the same reason: seasoning, not drift, and so the two lanes together can never carry more than 20% of the portfolio above 1.00× P/TBV (see “Portfolio-level valuation discipline” above).
When the growth data needed to check these gates isn’t available, the write-up says so rather than guessing — that gap is common enough (most companies don’t have clean multi-year revenue CAGR data available) that it needs to be named, not silently treated as a fail.
Where these rules come from. The evidence for and against this whole approach, with every source linked, lives on Does this actually work?. The 1994 Walter Schloss memo that inspired the shape of it is mapped rule by rule on Walter Schloss’s sixteen rules. The rules on this page are mine; those two pages are the receipts and the lineage.
What this page doesn’t cover
No crayon trend lines on stock charts. No buying whatever AI company had the shiniest keynote this quarter. No story stocks, no vibes, no “this time is different.” If it isn’t cheap against its own hard assets and it didn’t clear the survival screen, it isn’t on this page.