


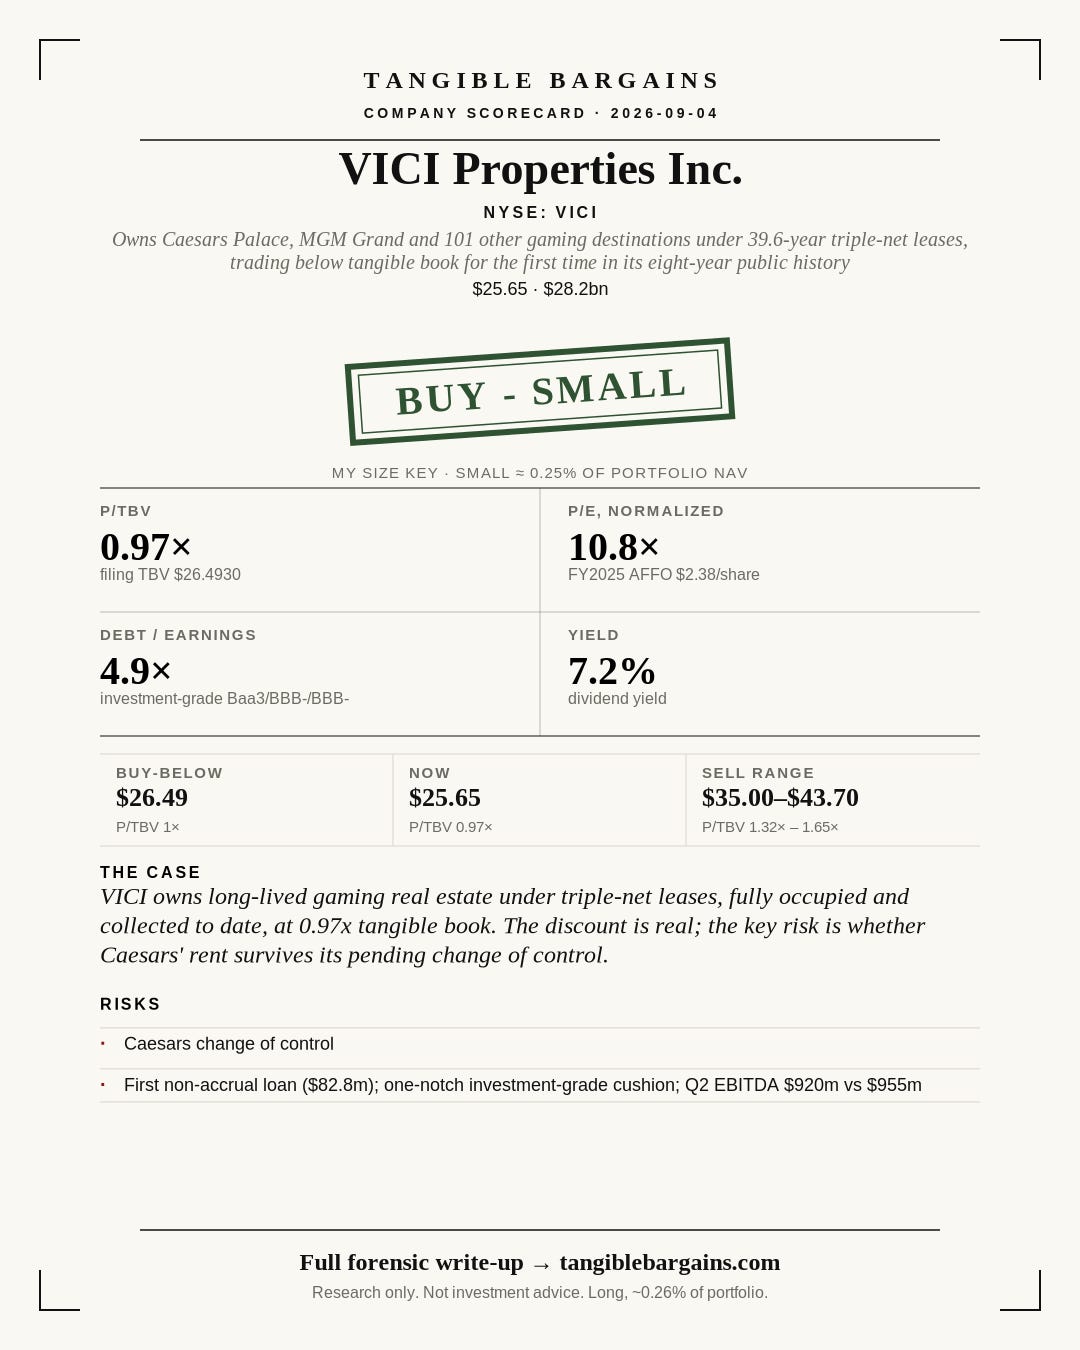
1. Scorecard
2. Argument
The short version
VICI owns the real estate under Caesars Palace, MGM Grand and 101 other casinos and resorts, collecting rent under leases that run 39.6 years on average and have never missed a payment since the company formed in 2017. The stock has never traded below its own tangible book value in eight years on the New York Stock Exchange. It does now.
That discount is thin, about three percent, and it exists mostly because Caesars, VICI’s biggest tenant at 38% of rent, is being taken private and management will not say what happens to the lease once the deal closes. The balance sheet is fine: leverage sits well inside house limits, the credit rating carries one notch of cushion, and the dividend has been raised every year since the company went public. What has to go right from here is Caesars staying a paying tenant on roughly the same terms once its ownership changes hands.
Why it qualifies
Trades at 0.968x tangible book value, the cheapest the stock has been since it started trading in 2018.
100% of its properties are leased, and rent has been collected in full every year since 2017, including through the pandemic.
Leverage of 58.0% of equity sits well inside the house ceiling, and net debt runs under five times cash earnings.
The dividend has been raised every year since the IPO and now yields 7.2%, with no cut or suspension on record.
Passes the quality screen five of seven measurable ways, with both failures explained by ordinary lease accounting rather than a real problem.
Why it is not a clean bargain
Caesars, its single largest tenant at 38% of rent, agreed in May 2026 to be taken private, and management would not give a timeline on what that means for the lease.
Caesars’ own results are softening: its operating profit fell year over year and it posted a net loss last quarter.
The company cannot grow by reinvesting its own cash. Almost everything it earns gets paid out as dividends, so new acquisitions depend on selling stock or borrowing, and it has mostly stopped selling stock below book value.
No insider bought a single share on the open market in the past year, even as the stock hit a 52-week low.
The margin of safety is thin, about three percent below tangible book, not a deep discount.
It just recorded its first-ever troubled loan: a small golf-resort loan now on non-accrual.
What would change the view
Any amendment to the Caesars master lease, or a rent cut tied to the change in Caesars’ ownership.
A ratings downgrade below investment grade at Moody’s, S&P or Fitch.
A second loan going onto non-accrual, which would suggest the first wasn’t a one-off.
The stock rising back above roughly $35.00 a share, which would put it in sell-range territory instead of buy territory.
Resumption of stock issuance below tangible book value, which would signal management is prioritizing growth over protecting per-share value.
Sources and gaps
Some detail on executive pay and related-party dealings comes from a large annual filing that wasn’t read start to finish; the parts that were reached showed nothing unusual. The historical valuation range used to set a target sell price comes from an outside data series, not independently rebuilt figure by figure. See the full detail for the source ledger, calculations, and complete diligence-gap log.
3. Backup and sources
This last layer is the full working file: every source, calculation, and gap, kept so the argument above can be checked. The scorecard and the argument are the synthesis. Open this only if you want to check the work.
VICI Properties Inc.: Full Analysis
1. Executive Summary
VICI Properties is a Maryland REIT that owns the land and buildings under 103 gaming, hospitality and leisure destinations across 26 US states, one US territory and one Canadian province: Caesars Palace Las Vegas, MGM Grand, Mandalay Bay and the Venetian Resort among them: and makes essentially all of its money collecting contractual rent from sixteen operating tenants under long-term triple-net leases in which the tenant pays every property cost, including taxes, insurance, maintenance and capital expenditure (Form 10-K FY2025, Item 1: Business; Q2 2026 financial supplement, portfolio summary). The verdict is BUY — SMALL. At the 3 September 2026 close of $25.65 the stock trades at 0.968× the tangible book value derived from the 30 June 2026 balance sheet ($26.4930 per share), the first time in the eight years of quarter-end history reviewed here that it has priced below its own tangible book, and it clears both of my absolute screens: P/TBV at or under 1.00×, and financial borrowings of $16,931.2 million against $29,170.7 million of common equity, or 58.0%: comfortably inside the 100% ceiling I use (Form 10-Q Q2 FY2026, consolidated balance sheets).
What the buyer gets is an unusually clean asset: no goodwill, no intangibles, no inventory, 0.2% of tangible book in right-of-use assets, and a book value already stated net of a $1,925.8 million expected-credit-loss allowance equal to 3.84% of the $49.5 billion amortised cost of the lease and loan portfolio (Form 10-Q Q2 FY2026, Note 5: Allowance for Credit Losses). Cash generation is heavy and predictable: $2,510.0 million of operating cash flow in FY2025 against $1.3 million of capital expenditure, because the tenants fund the buildings (Form 10-K FY2025, consolidated statements of cash flows). Adjusted funds from operations were $2.38 per share in FY2025 and are guided to $2.45 to $2.47 for FY2026, so the shares change hands at roughly 10.8 times trailing and 10.4 times forward cash earnings, against a $1.84 annualised dividend: a 7.2% yield after the 2.2% increase declared for the September 2026 quarter.
The margin of safety is real but thin: 3.2% against tangible book. The case rests more on the gap between a 7.8% implied capitalisation rate on the rent roll and the 8.9% weighted average initial yield VICI achieved on FY2025 commitments than on an asset discount. Three things argue against sizing this larger. Concentration: Caesars and MGM together provide 70% of annualised rent ($1,246.2 million and $1,065.0 million of $3,312.2 million), and the Las Vegas Strip produced 49% of FY2025 lease revenue. Change of control: Caesars agreed on 28 May 2026 to be taken private by Fertitta Entertainment, and management has declined to give a timeline on the associated lease discussions. And dilution: the share count has risen 75% since FY2021. Balance-sheet risk is Manageable but Baa3/BBB−/BBB− leaves one notch of cushion; accounting quality is Adequate, with one large judgemental estimate: the credit-loss allowance, also the auditor’s sole critical audit matter; governance risk is Low, with none of the five capital-allocation flags I check firing.
2. Business and Market Overview
VICI revenue is rent. FY2025 total revenues of $4,006.1 million comprised $2,125.4 million of income from sales-type leases, $1,763.5 million of income from lease financing receivables, loans and securities, $77.5 million of other income that is an exactly offsetting gross-up of ground-lease costs passed through to tenants, and $39.8 million of golf revenue from four owned courses (Form 10-K FY2025, consolidated statements of operations). Operating costs are trivial by design: general and administrative expense was $65.1 million, or 1.6% of revenue, and the company employed 28 people at 31 December 2025 (Form 10-K FY2025, Item 1: Human Capital Management). Everything else on the income statement is interest, non-cash credit-loss provisioning, and depreciation of $3.6 million.
The lease structure is the business. Seventeen leases, fifteen of which carry CPI-linked escalation for some part of their life, initial terms of 15 to 32 years with tenant renewal options of a further 5 to 30 years, and a weighted average lease term including options of 39.6 years at 31 December 2025. Forty-two per cent of FY2025 rent and roughly 90% of rent over the long term escalates with CPI subject to caps; the balance escalates at a fixed 1% to 2%. Occupancy is 100% and management states rent collection has been 100% since formation in October 2017, including through the pandemic (Form 10-K FY2025, Item 1).
Customer concentration is the defining exposure and is disclosed plainly. MGM lease agreements produced 38% of FY2025 lease revenues and 36% of contractual rent; Caesars 36% and 37% (Form 10-K FY2025, Note 2: Concentrations of Credit Risk). On the July 2026 rent roll the ranking inverts slightly: Caesars $1,246.2 million (38%), MGM $1,065.0 million (32%), the Venetian tenant $308.7 million (9%): with no other tenant above 4.4% of the $3,312.2 million total. Both master-lease families are guaranteed at parent level by Caesars Entertainment, Inc. and MGM Resorts International, so the credit runs to the public operator rather than to the property.
Diversification is the stated strategy and is visibly progressing. As of 30 June 2026 the tenant count reached sixteen: the $1,148.0 million Golden Entertainment sale-leaseback of seven Nevada casinos closed 30 April 2026 at $87.0 million of initial annual rent on a 30-year master lease; a severance lease for MGM Northfield Park with a Clairvest affiliate began 21 April 2026 at $53.0 million; the C$200.6 million Gamehost acquisition in Alberta closed 24 June 2026, adding C$16.1 million of rent to the PURE master lease; and Club Med became the sixteenth tenant on 15 June 2026 through a $20.3 million purchase of the Carambola Beach Resort plus a $55.2 million redevelopment commitment (Form 10-Q Q2 FY2026, Note 3). A parallel $2.9 billion credit book at a 9.1% weighted average rate is originated as a route into future ownership, most conspicuously a $1.5 billion mezzanine loan on the One Beverly Hills development advanced 23 March 2026.
The business is understandable, highly predictable and structurally low-capital-intensity for the landlord, with heavy regulatory exposure only indirectly, through the gaming licences its tenants hold. It is not a melting ice cube; the honest risk is not obsolescence but tenant credit and the terminal value of leases whose contractual escalators may lag replacement cost over a forty-year horizon.
3. Moat, Competitive Position, and Industry Cycle
Against the five moat sources, VICI scores clearly on two and partially on one. Efficient scale is genuine: approximately 130 million square feet, 66,000 hotel rooms and roughly 33 acres of undeveloped Strip-adjacent land, assets that are expensive to replicate and, on the Las Vegas Strip, effectively irreplaceable, with the gaming licensing regime restricting who may operate on them. Switching costs are extreme in the only sense that matters to a landlord: a tenant that has spent decades building a branded destination on a site cannot move it, and the master-lease structure bundles strong and weak assets so it cannot cherry-pick which to renew. Cost advantage is partial and cyclical: investment-grade ratings lower the cost of capital relative to private buyers, but that is a function of the credit cycle rather than anything proprietary. Brand and network effects are absent; the tenants own the brands and the customers.
The evidence sits in the numbers rather than the narrative: 100% occupancy, 100% collection through COVID, a 39.6-year weighted average lease term, and revenue compounding from $1,509.6 million in FY2021 to $4,006.1 million in FY2025 without a single lease default. Against that stands a hard qualification: VICI cannot compound capital internally: a REIT distribution requirement and a 73% AFFO payout leave almost nothing retained: so incremental return depends entirely on issuing securities above the economic cost of the assets bought. When the equity trades below tangible book, as today, that engine stalls. Management conceded the point on the Q2 2026 call, arguing that with the loan book yielding roughly 9.5% capital is better deployed into credit than into repurchasing its own shares.
Moat: Moderate. Real and durable in the assets and the lease documents, but dependent on external capital markets rather than on internal reinvestment economics, and capped by the fact that a landlord captures the escalator, not the operating upside.
Cycle position: Below mid-cycle. Las Vegas and regional gaming fundamentals have softened: Caesars reported Q2 2026 consolidated Adjusted EBITDA of $920 million against $955 million a year earlier and a $62 million net loss: and the REIT sector is absorbing a higher-for-longer rate environment; VICI shares are down roughly 18.5% over twelve months and set a fresh 52-week low of $25.34 in the week of this analysis. Rent itself has not declined: escalators are contractual and the FY2026 AFFO guide is up about 3% per share on FY2025. The cycle pressure sits in the discount rate applied to that rent and in tenant coverage, not yet in the cash flow.
4. Management, Governance, and Capital Allocation
Edward B. Pitoniak has been Chief Executive Officer since the company was formed in 2017 and is the only non-independent director; John W. R. Payne is President and Chief Operating Officer, David A. Kieske Executive Vice President, Chief Financial Officer and Treasurer, and Samantha S. Gallagher Executive Vice President, General Counsel and Secretary: the same four throughout the period reviewed. James R. Abrahamson chairs an otherwise fully independent board of seven (Definitive Proxy Statement filed 16 March 2026). On 24 February 2026 the board appointed Jeremy L. Waxman, a seven-year employee and former Ernst and Young senior manager, as Vice President, Chief Accounting Officer effective 1 March 2026; the outgoing principal accounting officer, Gabriel F. Wasserman, moved to an expanded business-development role rather than departing, and the filing states there are no arrangements, no family relationships and no related transactions associated with the appointment (Form 10-K FY2025, Item 9B): the benign version of this event, not the unexplained-departure version.
On 25 February 2026 the company entered amended and restated employment agreements with all four named executives, removing the fixed terms and associated non-renewal severance: a shareholder-favourable change: applying uniform 12-month non-compete covenants, and setting 2026 base salaries of $1,000,000 (Pitoniak), $1,200,000 (Payne), $670,000 (Kieske) and $648,000 (Gallagher) with target bonuses of 225%, 135%, 150% and 150% of salary. Total pay is large relative to the payroll it sits on: the 2025 chief-executive Summary Compensation Table total was $14,007,585 and the average for the other three $5,691,972, so roughly $31 million of the $65.1 million FY2025 general and administrative line is four people at a 28-employee company. Against $2,510.0 million of operating cash flow that is 0.56%, in line with large-cap REIT practice, and the April 2026 say-on-pay vote passed with 94.9% support.
Insider activity over the last twelve months, from every Form 4 filed between January and July 2026, shows no open-market purchase and no open-market sale by any officer or director. The filings cluster on 2 January, 24 February, 2 April and 1 July 2026 and consist of quarterly director retainer grants, the annual executive equity award, and shares surrendered for tax withholding on vesting restricted stock. The two read in full are representative: Ms Gallagher surrendered 3,554 shares at $29.87 and 4,671 at $30.09 on 20 and 23 February 2026, then received a 30,309-share award on 24 February, ending at 368,018 shares; Mr Pitoniak gifted 20,000 shares to a non-profit educational institution on 1 June 2026, leaving 1,291,210. Absence of insider buying with the stock at a 52-week low is a non-confirmation rather than a red flag; directors face a five-times-retainer ownership guideline and the company maintains anti-hedging, anti-short-sale and anti-pledging policies.
Capital allocation has been consistent and disciplined. There have been no share repurchases in any period reviewed: the only amounts so labelled are $7.2 million (FY2025), $5.3 million (FY2024) and $5.0 million (FY2023) of shares taken back for tax withholding: and management said on the Q2 2026 call that buybacks make limited sense for a capital-dependent REIT with a 9.5%-yielding loan pipeline. The dividend has been raised every year of the company’s public life, from $1.610 per share declared in FY2023 to $1.695 in FY2024 to $1.765 in FY2025 and, as of the September 2026 declaration, to $0.46 per quarter: a 2.2% increase and a $1.84 annual rate payable 8 October 2026 to holders of record on 17 September 2026. There has never been a cut or a suspension. Equity issuance has tracked the share price: $2,385.8 million, $3,219.1 million and $2,480.1 million in FY2021 to FY2023, falling to $378.7 million and $375.3 million in FY2024 and FY2025. FY2025 commitments of approximately $2.1 billion were struck at a weighted average initial yield of 8.9%, above the 4.454% weighted average cost of debt: which is why a 75% rise in share count since FY2021 has coincided with tangible book per share rising from $19.25 to $26.49.
Related-party review found nothing to report, and the search was independent rather than inherited from an outside narrative. The 2026 proxy carries a written related-party transaction policy and states there are no material related-party transactions and no family relationships among directors or executive officers; the FY2025 annual report contains no related-party note and discloses no intercompany or affiliate lending, guarantee, deposit or nominee arrangement. On the financial-relationship limb specifically: deposits with a related-party-affiliated bank, facilities either way, guarantees either way: the filings disclose none, and the guarantees that exist run towards VICI from Caesars and MGM. The only affiliate-adjacent arrangements are ordinary-course: the golf-course management agreement with Cabot-Managed Properties, an affiliate of Cabot to which VICI is also a lender and the counterparty on an agreement converting part of a $120.0 million Cabot Citrus Farms development loan into owned real estate, and the Golf Course Use Agreement with Caesars at minimum fees of $17.6 million a year. The Cabot overlap is worth watching because VICI is landlord, lender and prospective buyer to one counterparty; nothing suggests off-market pricing, but the concentration of roles is worth stating rather than leaving implicit.
None of the five governance red flags I check fired here. No holder controls the company: the largest position is Vanguard’s 7.86%, and all seven directors were elected individually under a majority-voting standard at the 28 April 2026 annual meeting, with the lowest-supported nominee still winning 96.4% of votes cast. There is no parent to route capital toward, and FY2025’s acquisitions were struck at an 8.9% initial yield. The dividend has been raised in every year of the company’s public life and yields 7.2% today. Management did decline, on the Q2 2026 call, to give a timeline for the Caesars lease discussions or to pre-commit on regional acquisitions, but both read as ordinary confidentiality around live, sensitive negotiations rather than evasiveness: the capital-allocation question that actually mattered, why the credit allowance rose, got a specific, checkable answer. Stock-based compensation ran 0.58% of net income in FY2025 and 0.65% in FY2024, an order of magnitude below what would concern me, and falling rather than rising. Governance risk here is Low.
5. Corporate Ownership, Subsidiaries, and Joint Ventures
The ownership register is institutional and unconcentrated. Vanguard’s fund-management arms hold the two largest positions: 7.86% and 6.91%: after a January 2026 internal realignment moved The Vanguard Group’s own directly-reported stake to zero. Capital Research Global Investors holds 4.8% and Capital International Investors 1.8%. Chief executive Edward Pitoniak holds 1,291,210 shares, about 0.12% of the class, for scale against the institutional positions above. No holder controls the company, no dual-class structure exists, and the largest single reported position is under 8%.
There is one class of common stock carrying one vote per share, 1,101,074,906 shares issued and outstanding at 30 June 2026, no preferred stock outstanding against 50,000,000 authorised, and 350 holders of record at 24 February 2026. No control block, no shareholder agreement and no acting-in-concert arrangement is disclosed anywhere in the record.
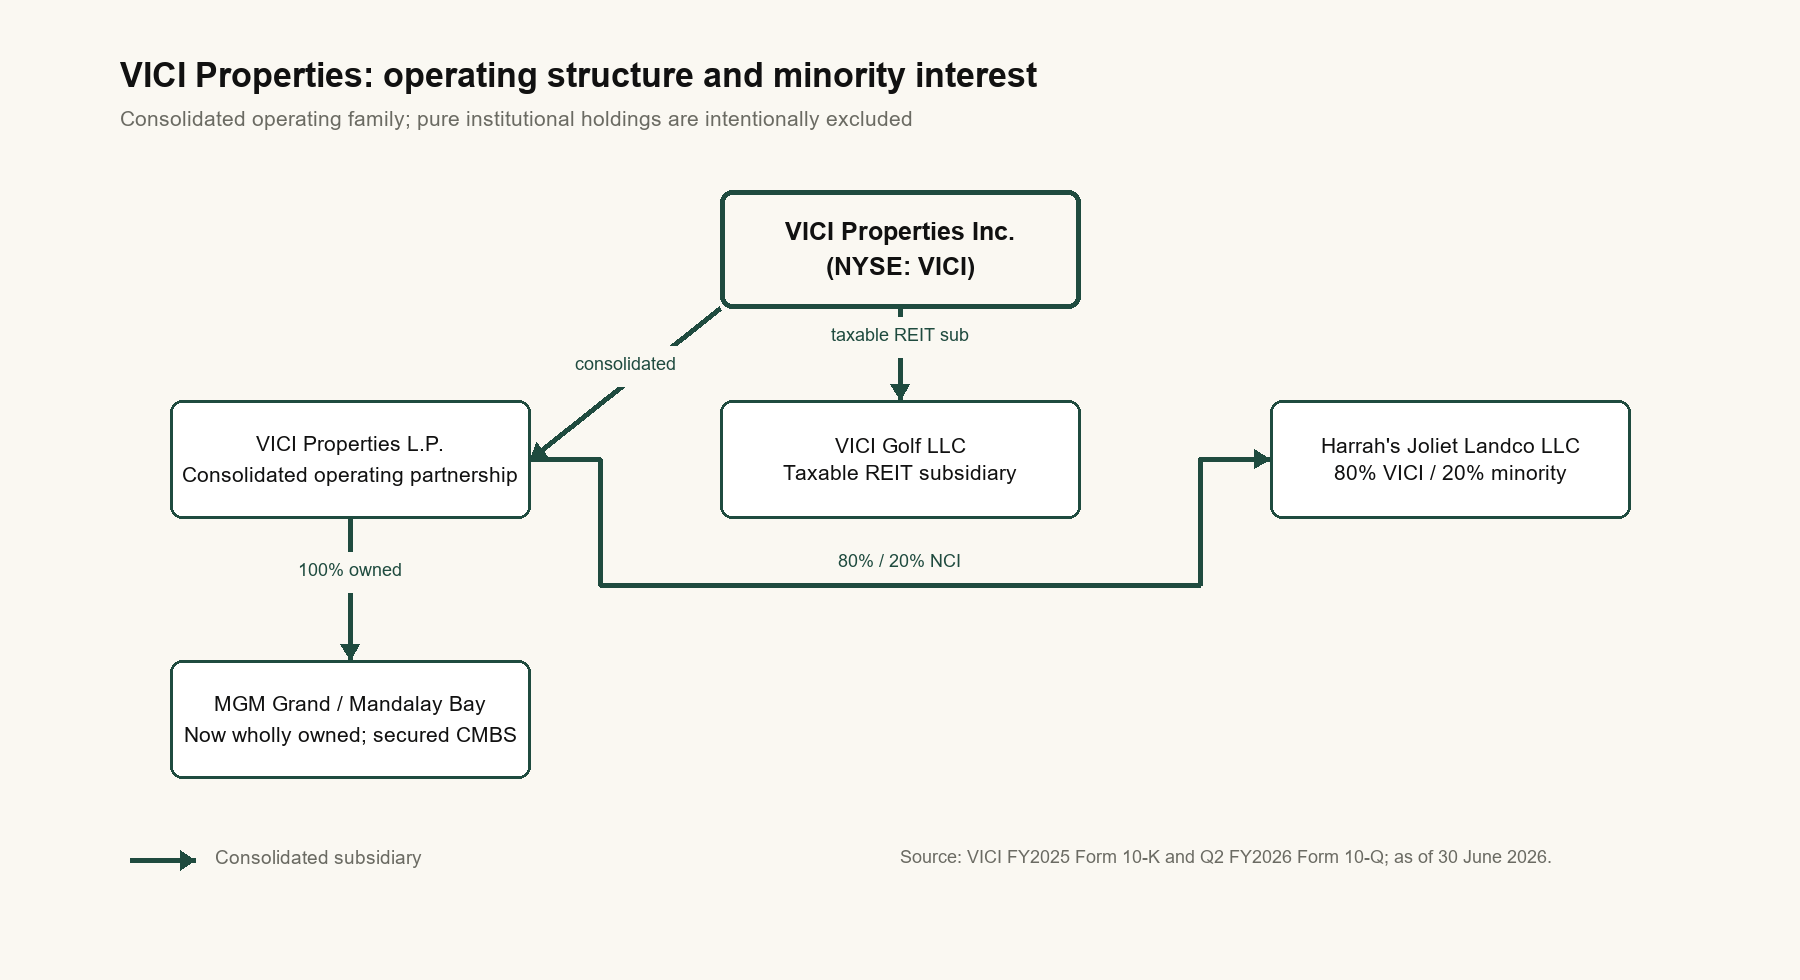
The structure below the REIT is simple but not trivial. Substantially all real property is held through VICI Properties L.P., a consolidated operating partnership that is a co-registrant and publishes its own audited statements inside the same annual report; golf sits in a taxable REIT subsidiary, VICI Golf LLC. Non-controlling interests of $431,962 thousand at 30 June 2026: 1.5% of total equity: are third-party operating-partnership units plus the 20% minority in Harrah’s Joliet Landco LLC, in which a VICI LP subsidiary is the 80% owner and managing member. The remaining 49.9% of the MGM Grand/Mandalay Bay joint venture was acquired in January 2023, so that vehicle is now wholly owned; its $3.0 billion 3.558% CMBS financing runs to March 2032 and is the only secured debt in the capital structure: the one genuine ring-fencing feature, with 17.4% of borrowings sitting against two named assets ahead of the unsecured creditors. Minority leakage is small: $43.1 million of FY2025 net income and $32.2 million of distributions. The MGM tax protection agreement is a real constraint on deleveraging, covered in the debt discussion below.
6. Historical Financial Quality and Normalized Owner Earnings
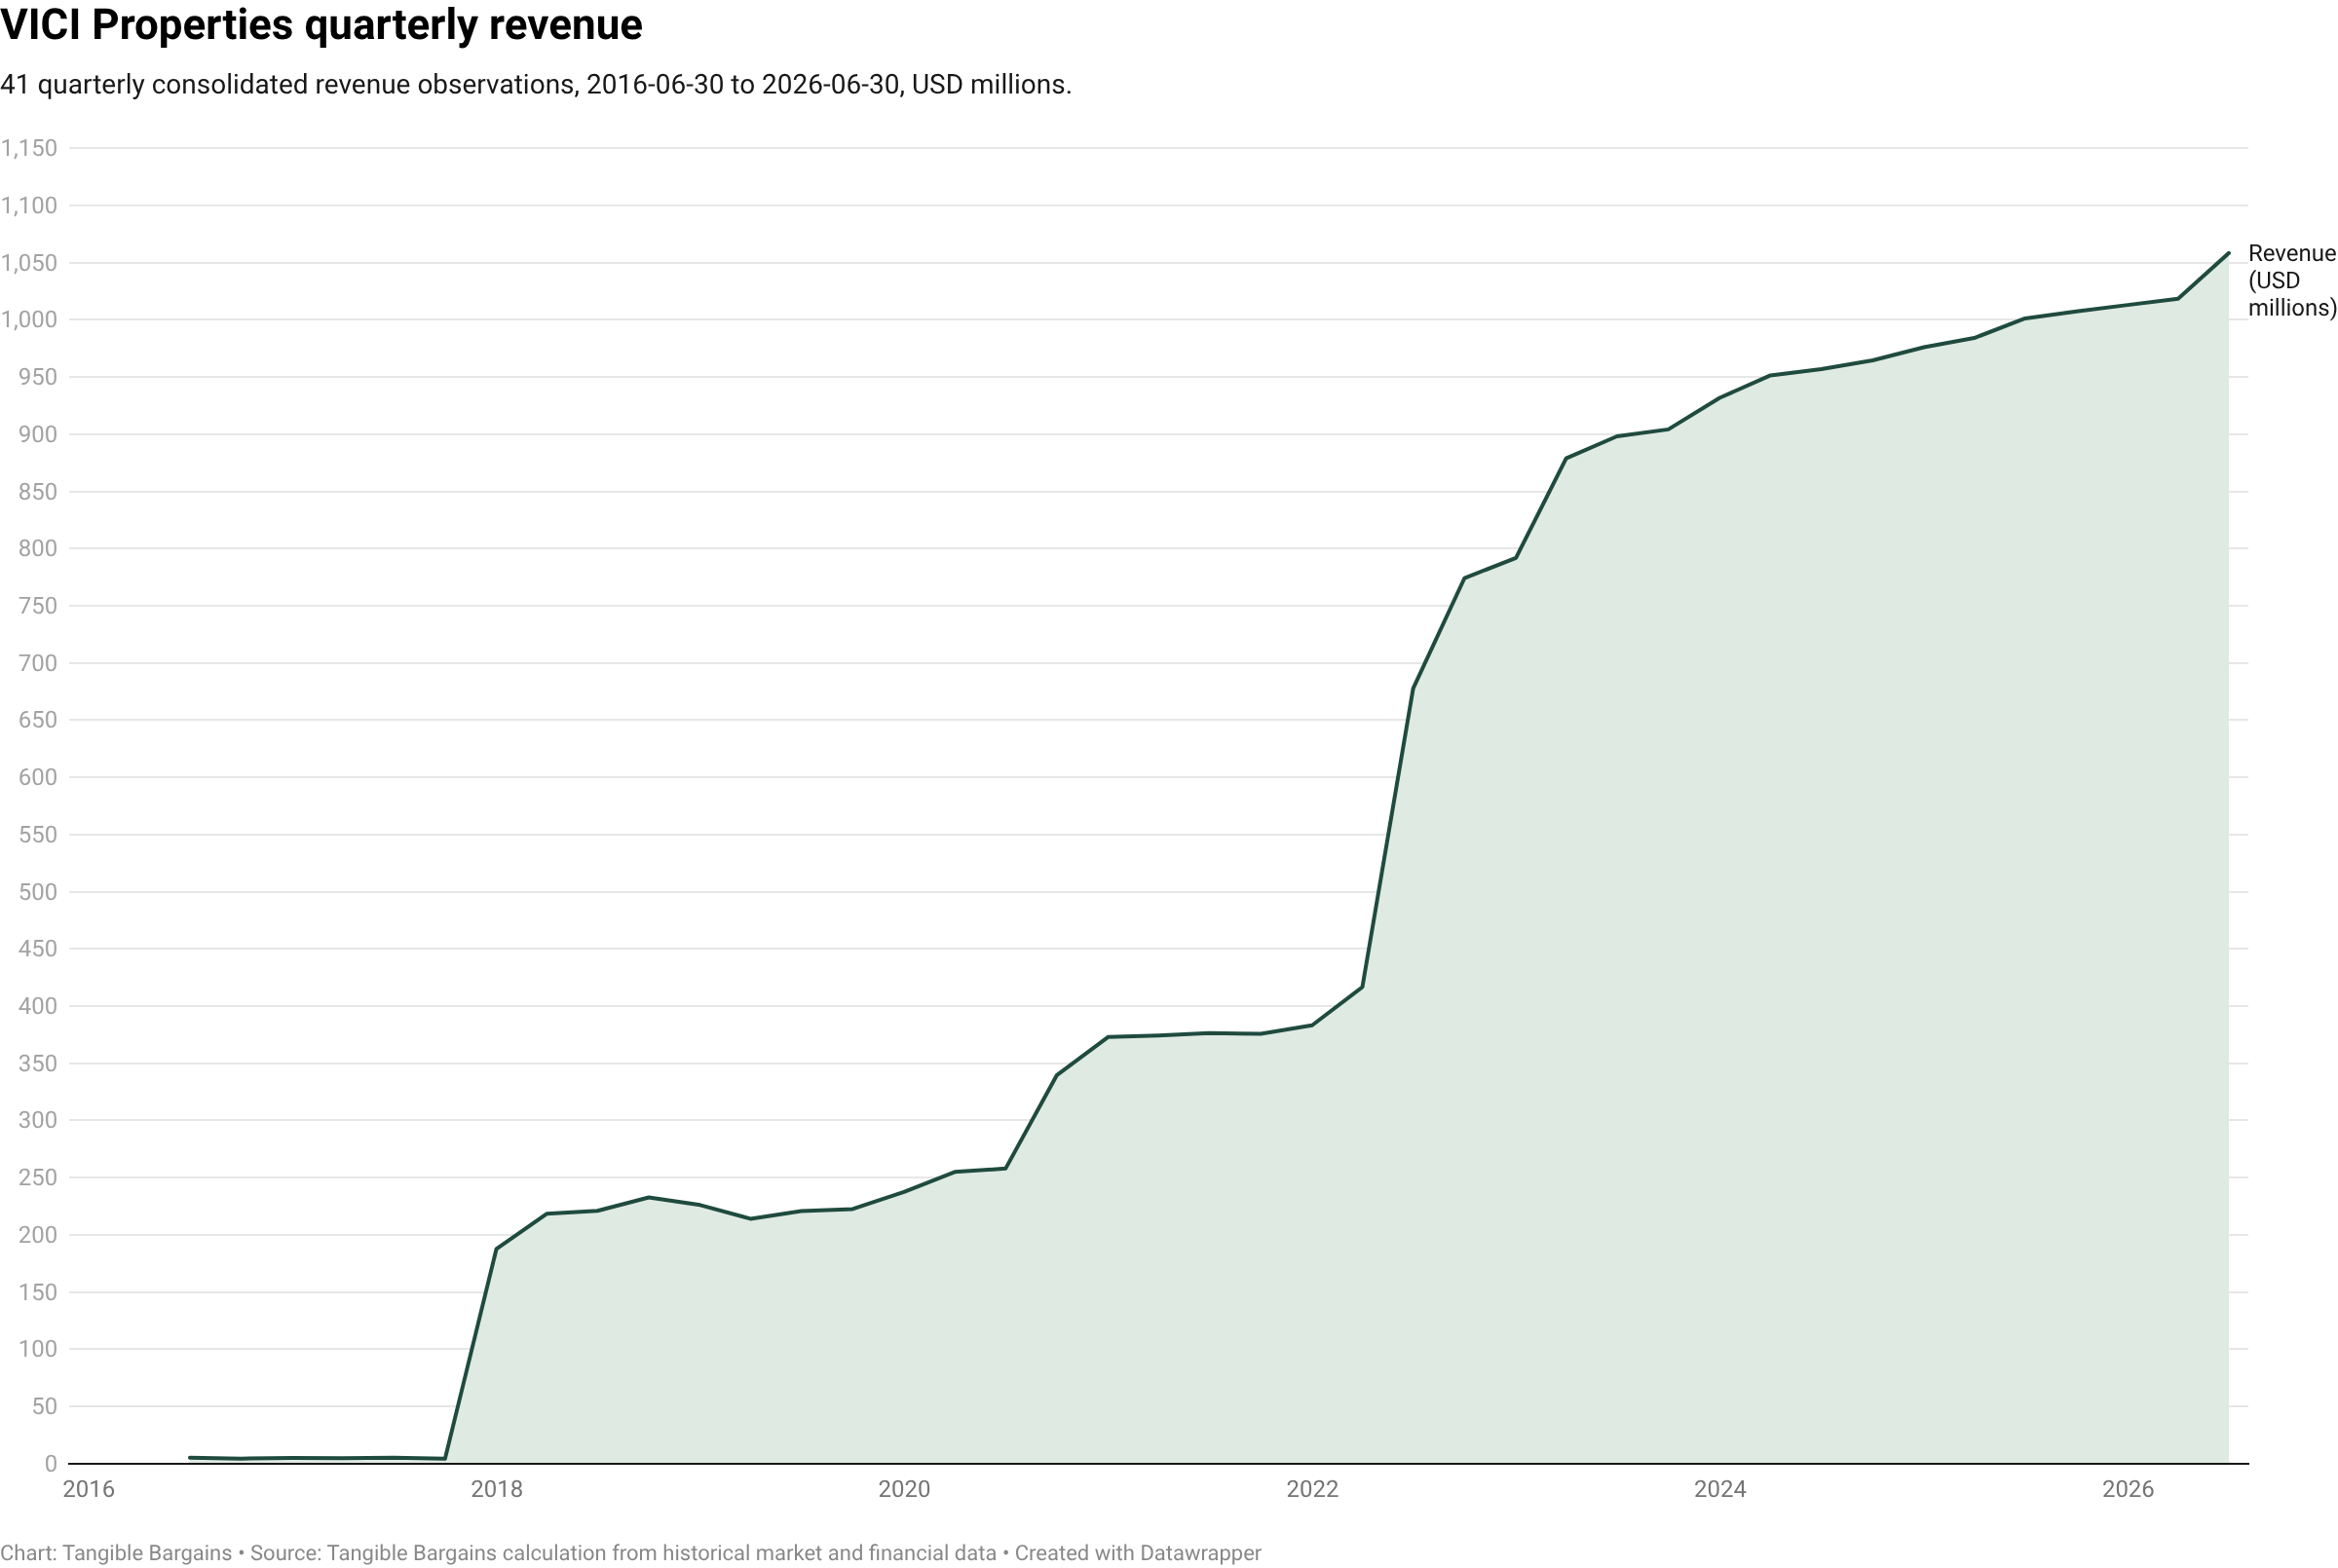
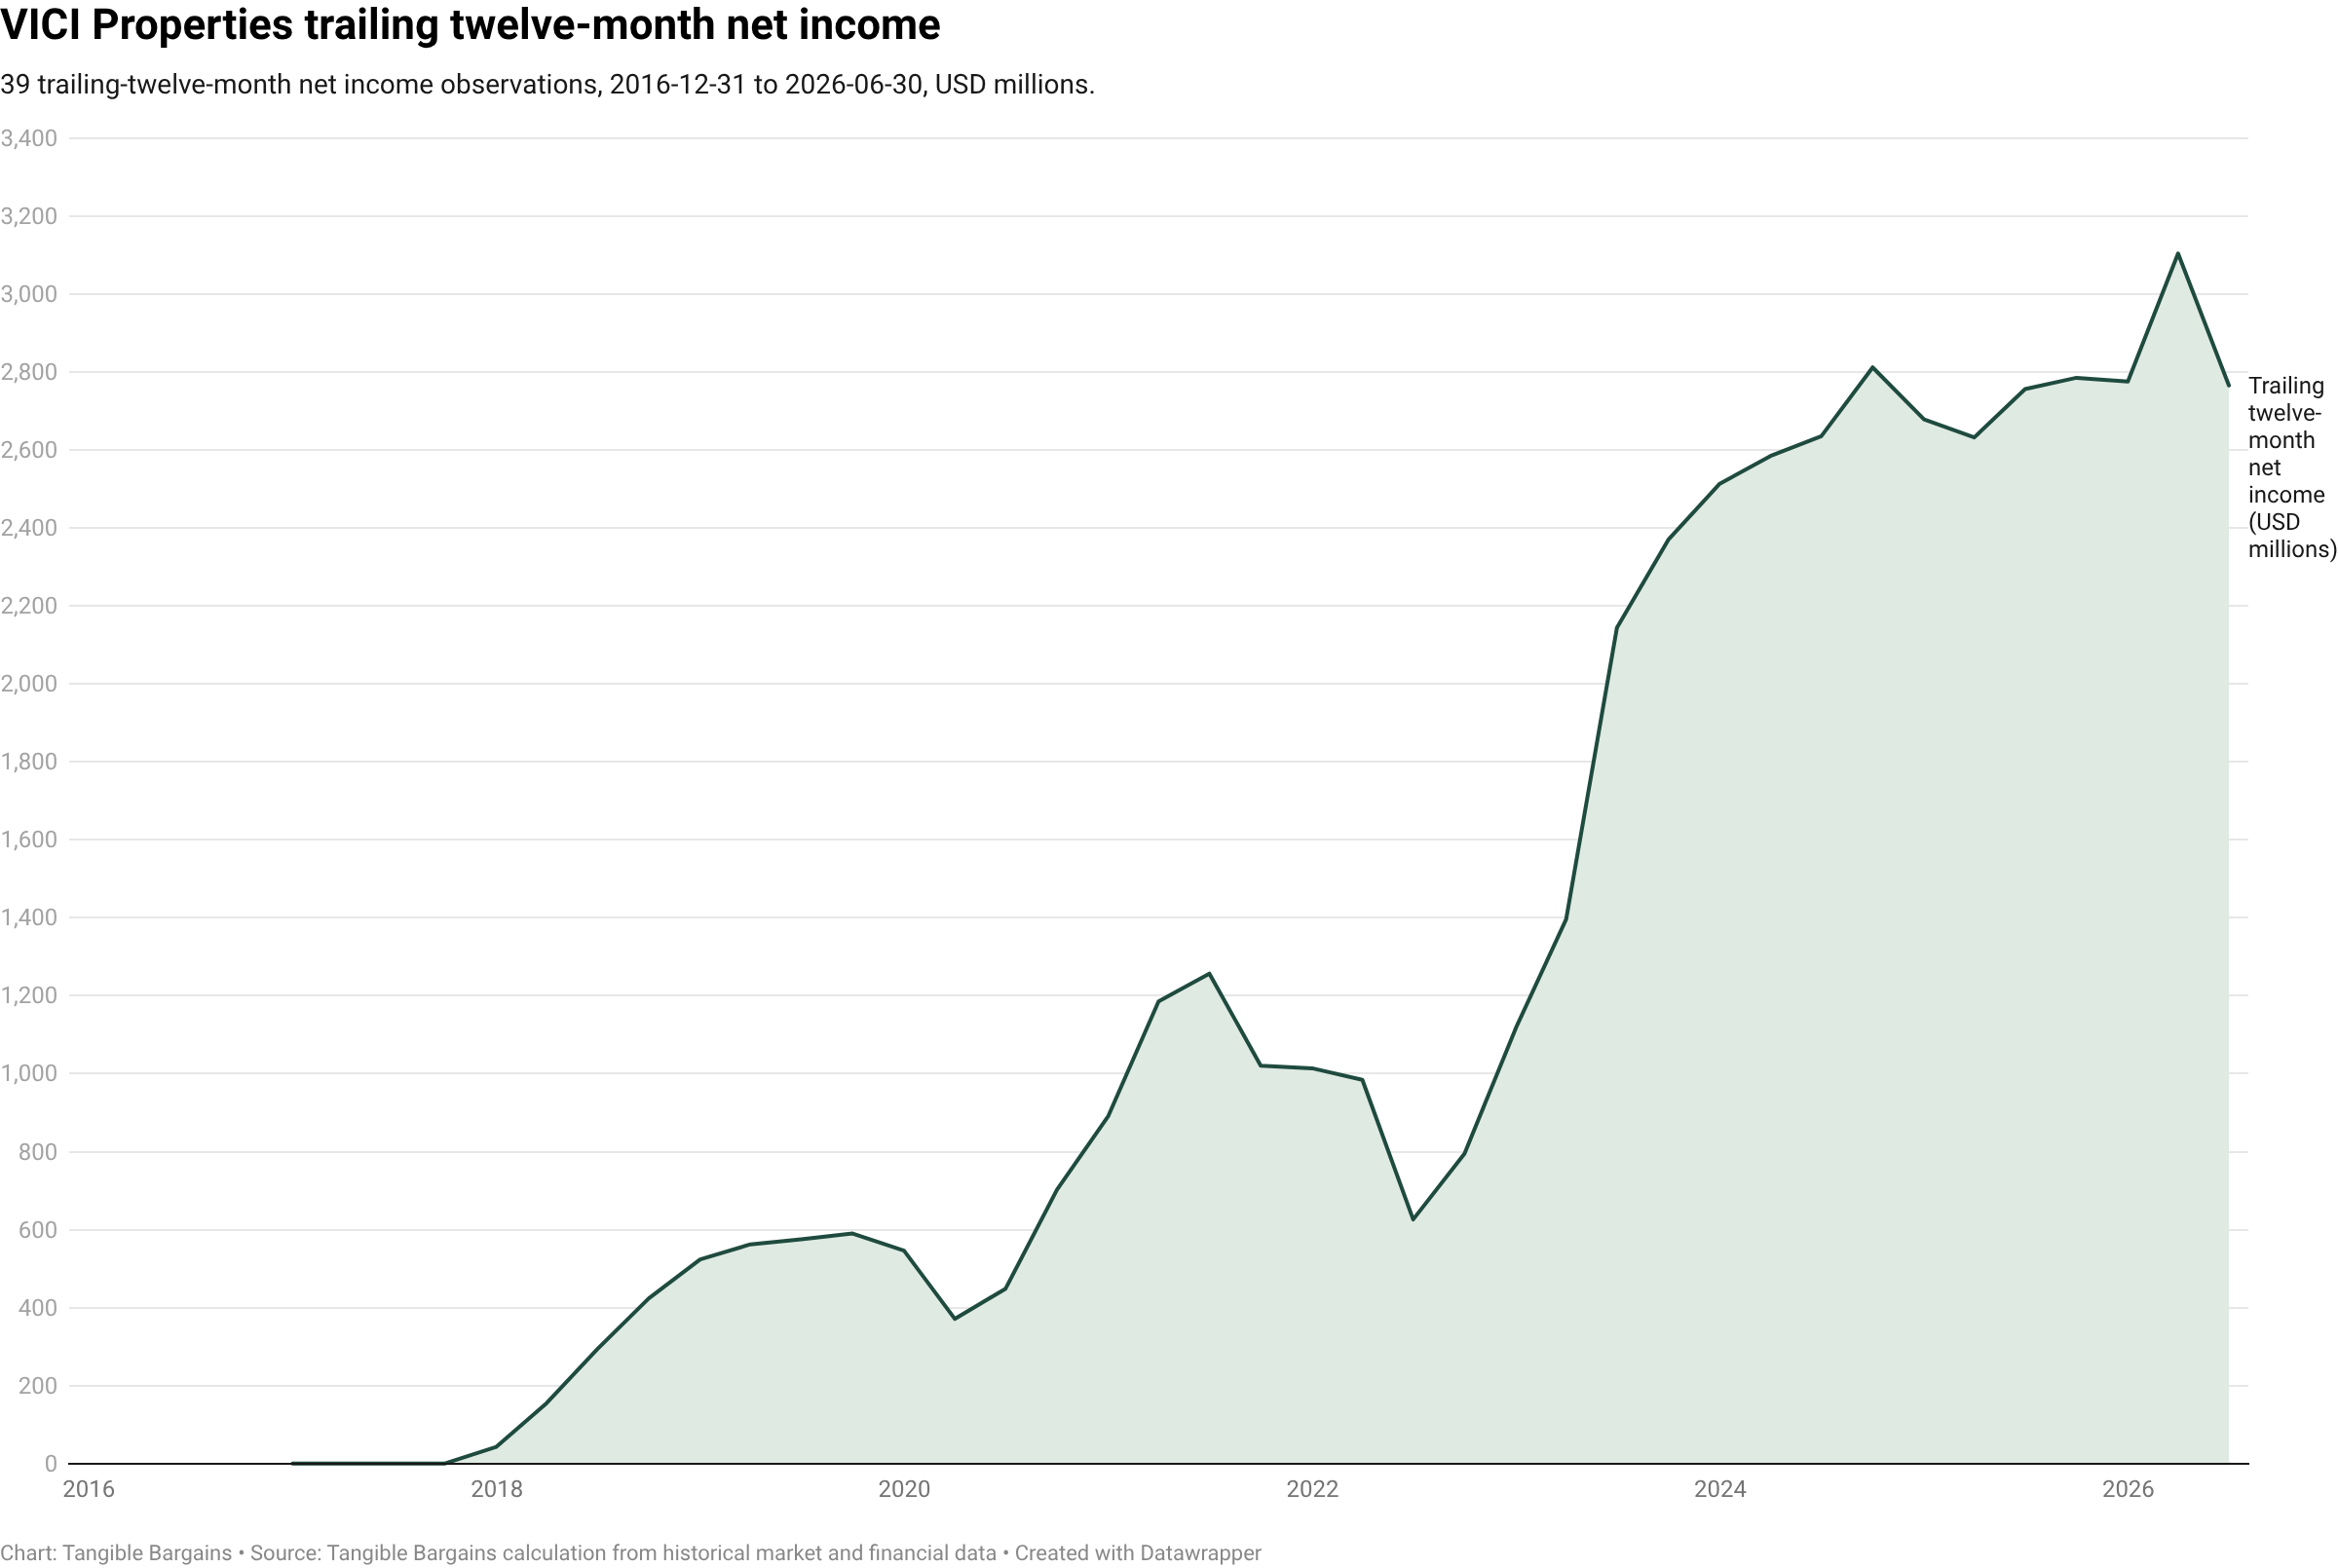
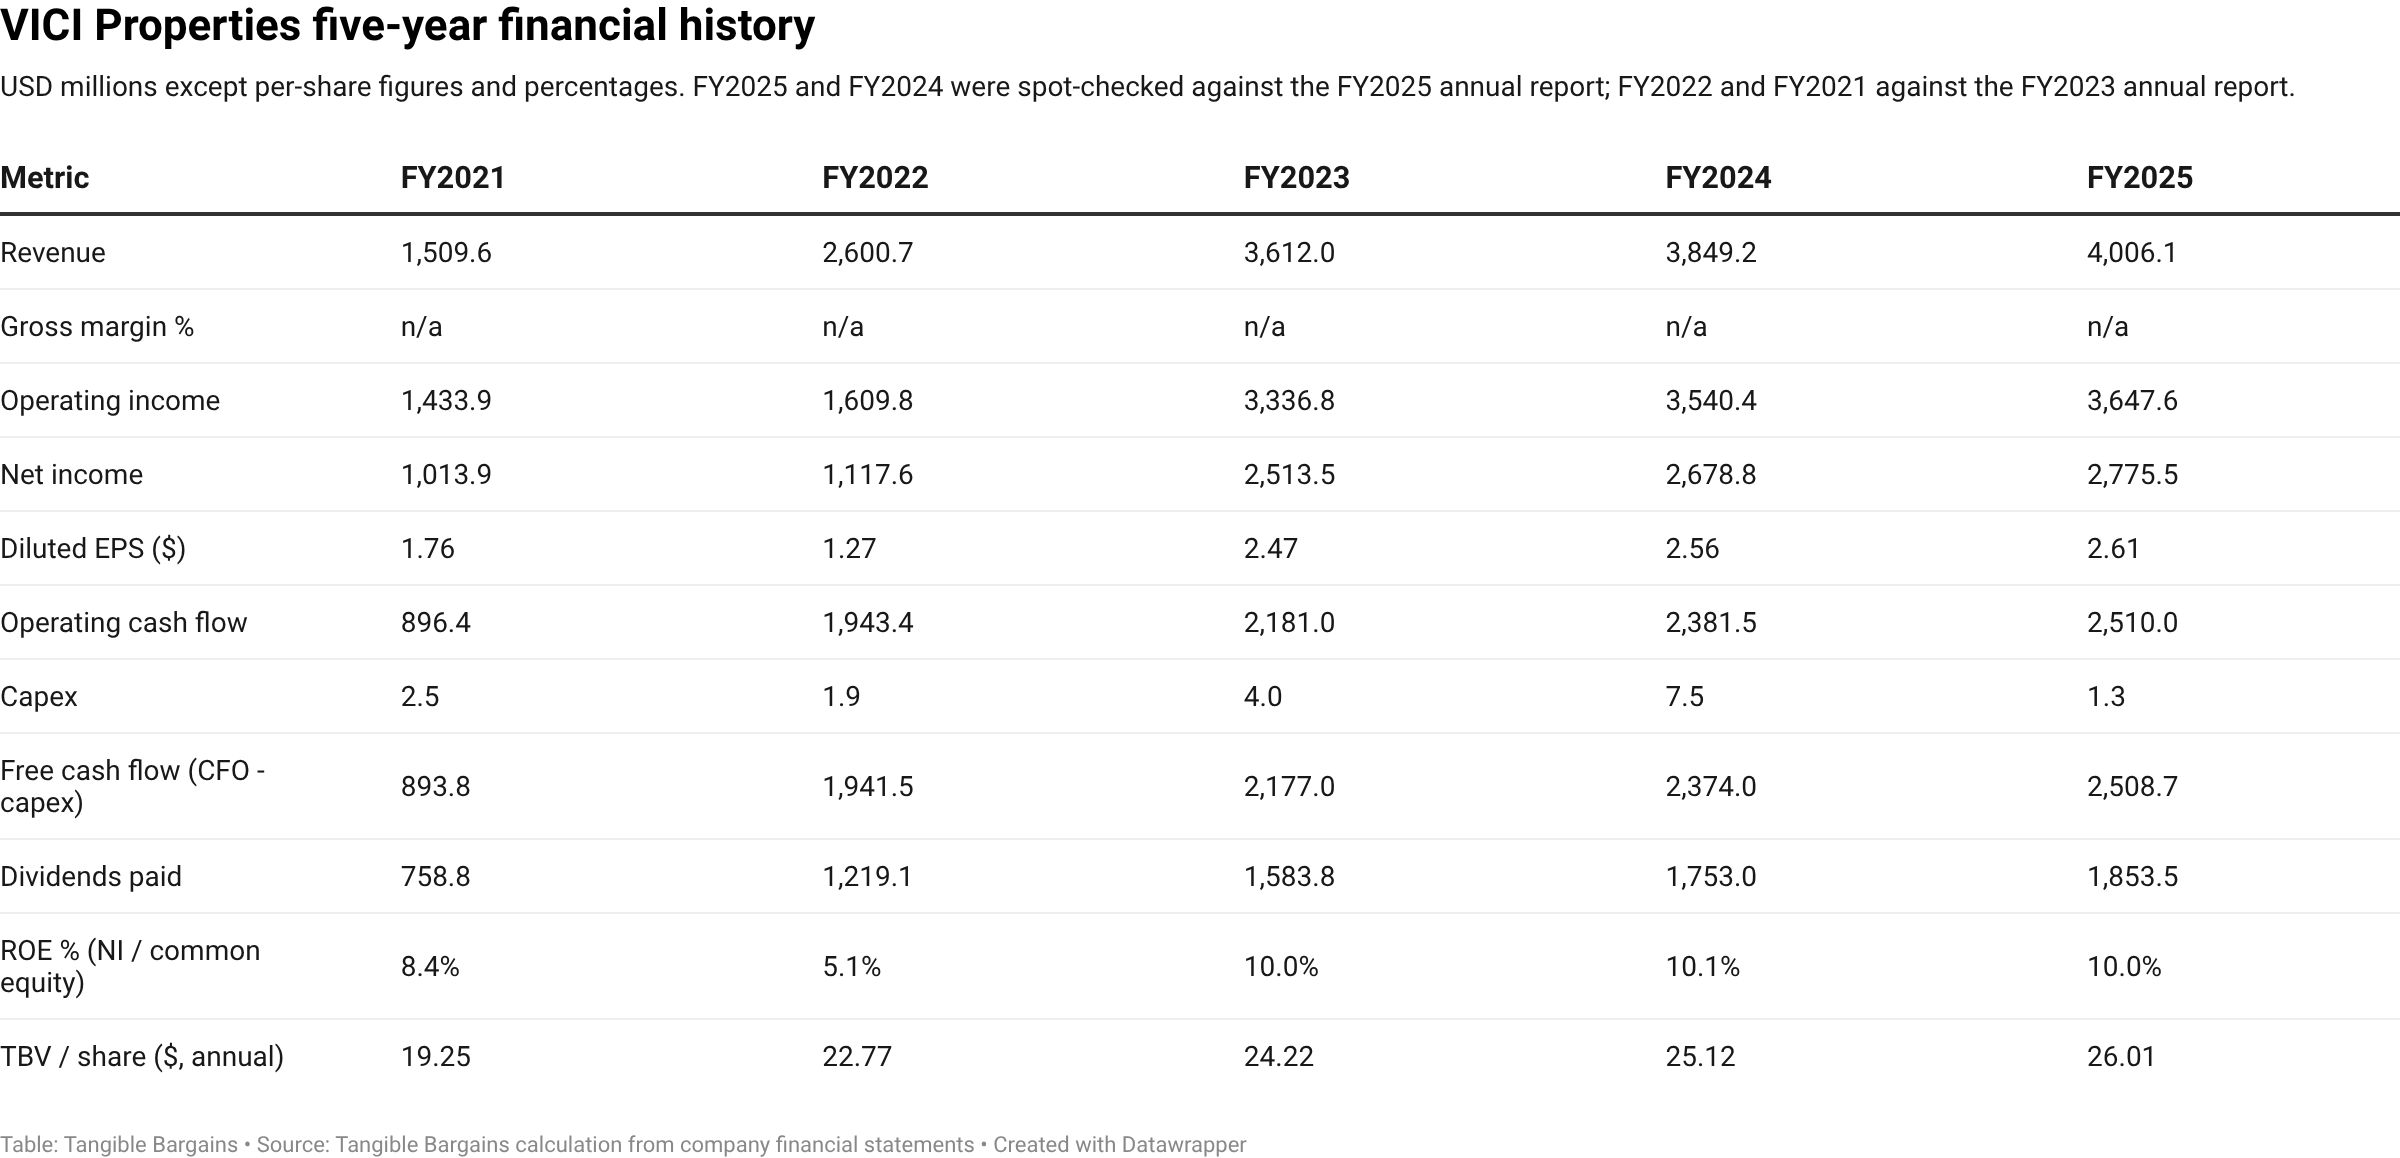
Five years of audited history show a company that roughly tripled in size and then stabilised. Revenue rose from $1,509.6 million in FY2021 to $4,006.1 million in FY2025, almost all of it acquired: the April 2022 acquisition of MGM Growth Properties and the February 2022 Venetian purchase took total assets from $17,597.4 million to $37,575.8 million and then $44,059.8 million at FY2023. Since then the balance sheet has grown 6% in two years while revenue grew 11%. The FY2022 earnings dip, diluted EPS of $1.27 against $1.76 and $2.47 either side, is not an operating event: it is the $834.5 million initial credit-loss allowance ASC 326 requires on day one of a large acquisition
.
Gross margin is shown as unavailable rather than as zero: the income statement carries no cost of revenue, and the concept does not exist for a triple-net lessor. Operating income above is total revenues less total operating expenses as presented. FY2025 and FY2024 were spot-checked line by line against the consolidated statements of operations in the FY2025 annual report, and the FY2022 and FY2021 comparatives against the FY2023 annual report.
Normalized owner earnings. The cash-flow statement is used rather than a proxy. FY2025 operating cash flow was $2,510.0 million against $1.3 million of capital expenditure: tenants fund maintenance and improvement under every lease: so free cash flow was $2,508.7 million, or $2,476.5 million after $32.2 million of distributions to non-controlling interests. On the FY2025 weighted diluted count of 1,062.7 million shares that is $2.33 per share of owner earnings, against the company’s own adjusted funds from operations of $2.38; the gap is $46.8 million of debt-issuance-cost amortisation and $16.2 million of stock compensation that AFFO adds back, less the minority distribution this measure deducts. Reported diluted EPS of $2.61 is the least useful: GAAP income includes $523.9 million of non-cash lease accretion and deducts a $177.9 million non-cash provision. A symmetric one-off check finds nothing material either way.
Normalized EPS and its basis. The trajectory is growing, not cyclical, so a ten-year average is inappropriate: there are only eight years of public history and the weighted diluted count has risen 84% since FY2021, making any multi-year per-share average an average of different companies. The figure used in the valuation discussion below is therefore $2.38, FY2025 adjusted funds from operations per diluted share: a full audited year, on the current share base, on the cash measure the business distributes from. Alternatives, so a reader can substitute: five-year average GAAP diluted EPS $2.13, trailing GAAP diluted EPS $2.58, FY2026 guided AFFO $2.45 to $2.47. At the current price these give normalized multiples of 10.8, 12.0, 9.9 and 10.4 times: all landing in the same cheap-and-modest-multiple corner, so the verdict does not turn on the choice.
The credit-loss allowance roll-forward. VICI carries a large loan-loss-equivalent account, so it is worth reconstructing from the note rather than inferring from the balance-sheet movement. The reserve began FY2023 at $1,368.8 million and has only ever grown: to $1,472.4 million at the end of FY2023, $1,594.9 million at FY2024, $1,775.8 million at FY2025 and $1,925.8 million at 30 June 2026. FY2023’s $293.0 million initial allowance on new investments reflects the day-one CECL charge on the MGM and Venetian acquisitions; the ongoing quarterly change in the allowance ($172.5 million in FY2025, $37.6 million in the first half of 2026) accounts for the rest of the growth.
The most important fact in that roll-forward is what never appears in it: there have been no charge-offs and no recoveries in any period since adoption, so the provision-to-payout ratio is not merely above 1.0: it is undefined, the denominator being zero. The reserve has only ever been built. That is the opposite of the pattern this kind of check exists to catch: the $1,925.8 million deducted from tangible book is an unused cushion, not a depleted one. It was 3.72% of $47,537.4 million of amortised cost at 31 December 2025 and 3.84% of roughly $49.5 billion at 30 June 2026. There is no off-balance-sheet guarantee reserve to compare against; the unfunded-commitment allowance, $22.9 million against $6.4 million at year-end, moved the same way, so the asymmetric-reserving check is clean.
Two qualifications. The allowance is a model output, not an observation: a discounted-cash-flow estimate driven by probability-of-default and loss-given-default assumptions from a third-party provider and keyed to guarantor credit ratings, and it is the auditor’s sole critical audit matter. Its volatility is real: a $271.1 million charge in Q2 2026 alone, driven, management explained, by a private tenant issuing senior secured debt at a lower rating than the proxy company previously used in the model, with the property described as performing. Second, VICI recorded its first credit event in Q4 2025: a fully funded senior secured loan of $82.8 million on a luxury golf-resort development was placed on non-accrual, the borrower in recapitalisation discussions: 0.17% of amortised cost, immaterial to book value, material as a first data point.
Earnings quality overall. Conversion is exceptional: $2,510.0 million of operating cash flow on $4,006.1 million of revenue, essentially all free: and receivables of $34.2 million leave no working-capital trap, because rent is paid in advance. The one structural concern is that GAAP net income exceeds cash by $265.5 million, which is what fails the cash-flow quality check below; retained earnings of $3,189.4 million are correspondingly the accumulated non-cash accretion, $1,848.9 million of it since FY2023 alone. Book-value growth from retained earnings is accounting accretion on assets already owned, not reinvested cash.
Piotroski F-Score: 5 of 7 computable signals (FY2025 versus FY2024), Eligible. Five passed: positive net income ($2,775.5 million), positive operating cash flow ($2,510.0 million), an improved return on assets (6.1% versus 6.1%, unchanged and counted as a pass on this method’s convention), debt that did not increase (36.4% of average assets versus 37.4%), and improved asset turnover (0.088 versus 0.087). Two failed: cash flow came in below net income ($2,510.0 million against $2,775.5 million), and net share issuance was positive rather than a buyback (a net $368.1 million issued, $7.2 million of tax-withholding repurchases against $375.3 million issued). Two of the nine standard signals are not computable at all for this business: VICI presents an unclassified balance sheet with no current-asset or current-liability subtotals, so no current ratio exists, and there is no cost of revenue on the income statement, so no gross margin exists. Marking either a failure rather than not-computable would be a fabricated result, and seven computable signals is enough for a real score.
The two failures are both structural, not warning signs. Cash flow trails net income because sales-type lease accounting recognizes rent as non-cash interest accretion on part of the portfolio; that will fail every year the accounting stays the same, on contracts collected in full and on time. Net issuance is negative because VICI funds acquisitions by selling shares above book, not because of dilution for its own sake, and tangible book per share rose from $19.25 to $26.01 over the same five years. The eligible rating held: leverage on this method’s definition actually decreased, from 37.4% to 36.4% of average assets, so the rule that would reject a name outright on rising leverage never engaged.
7. Balance Sheet, Debt, Covenants, and Refinancing Risk
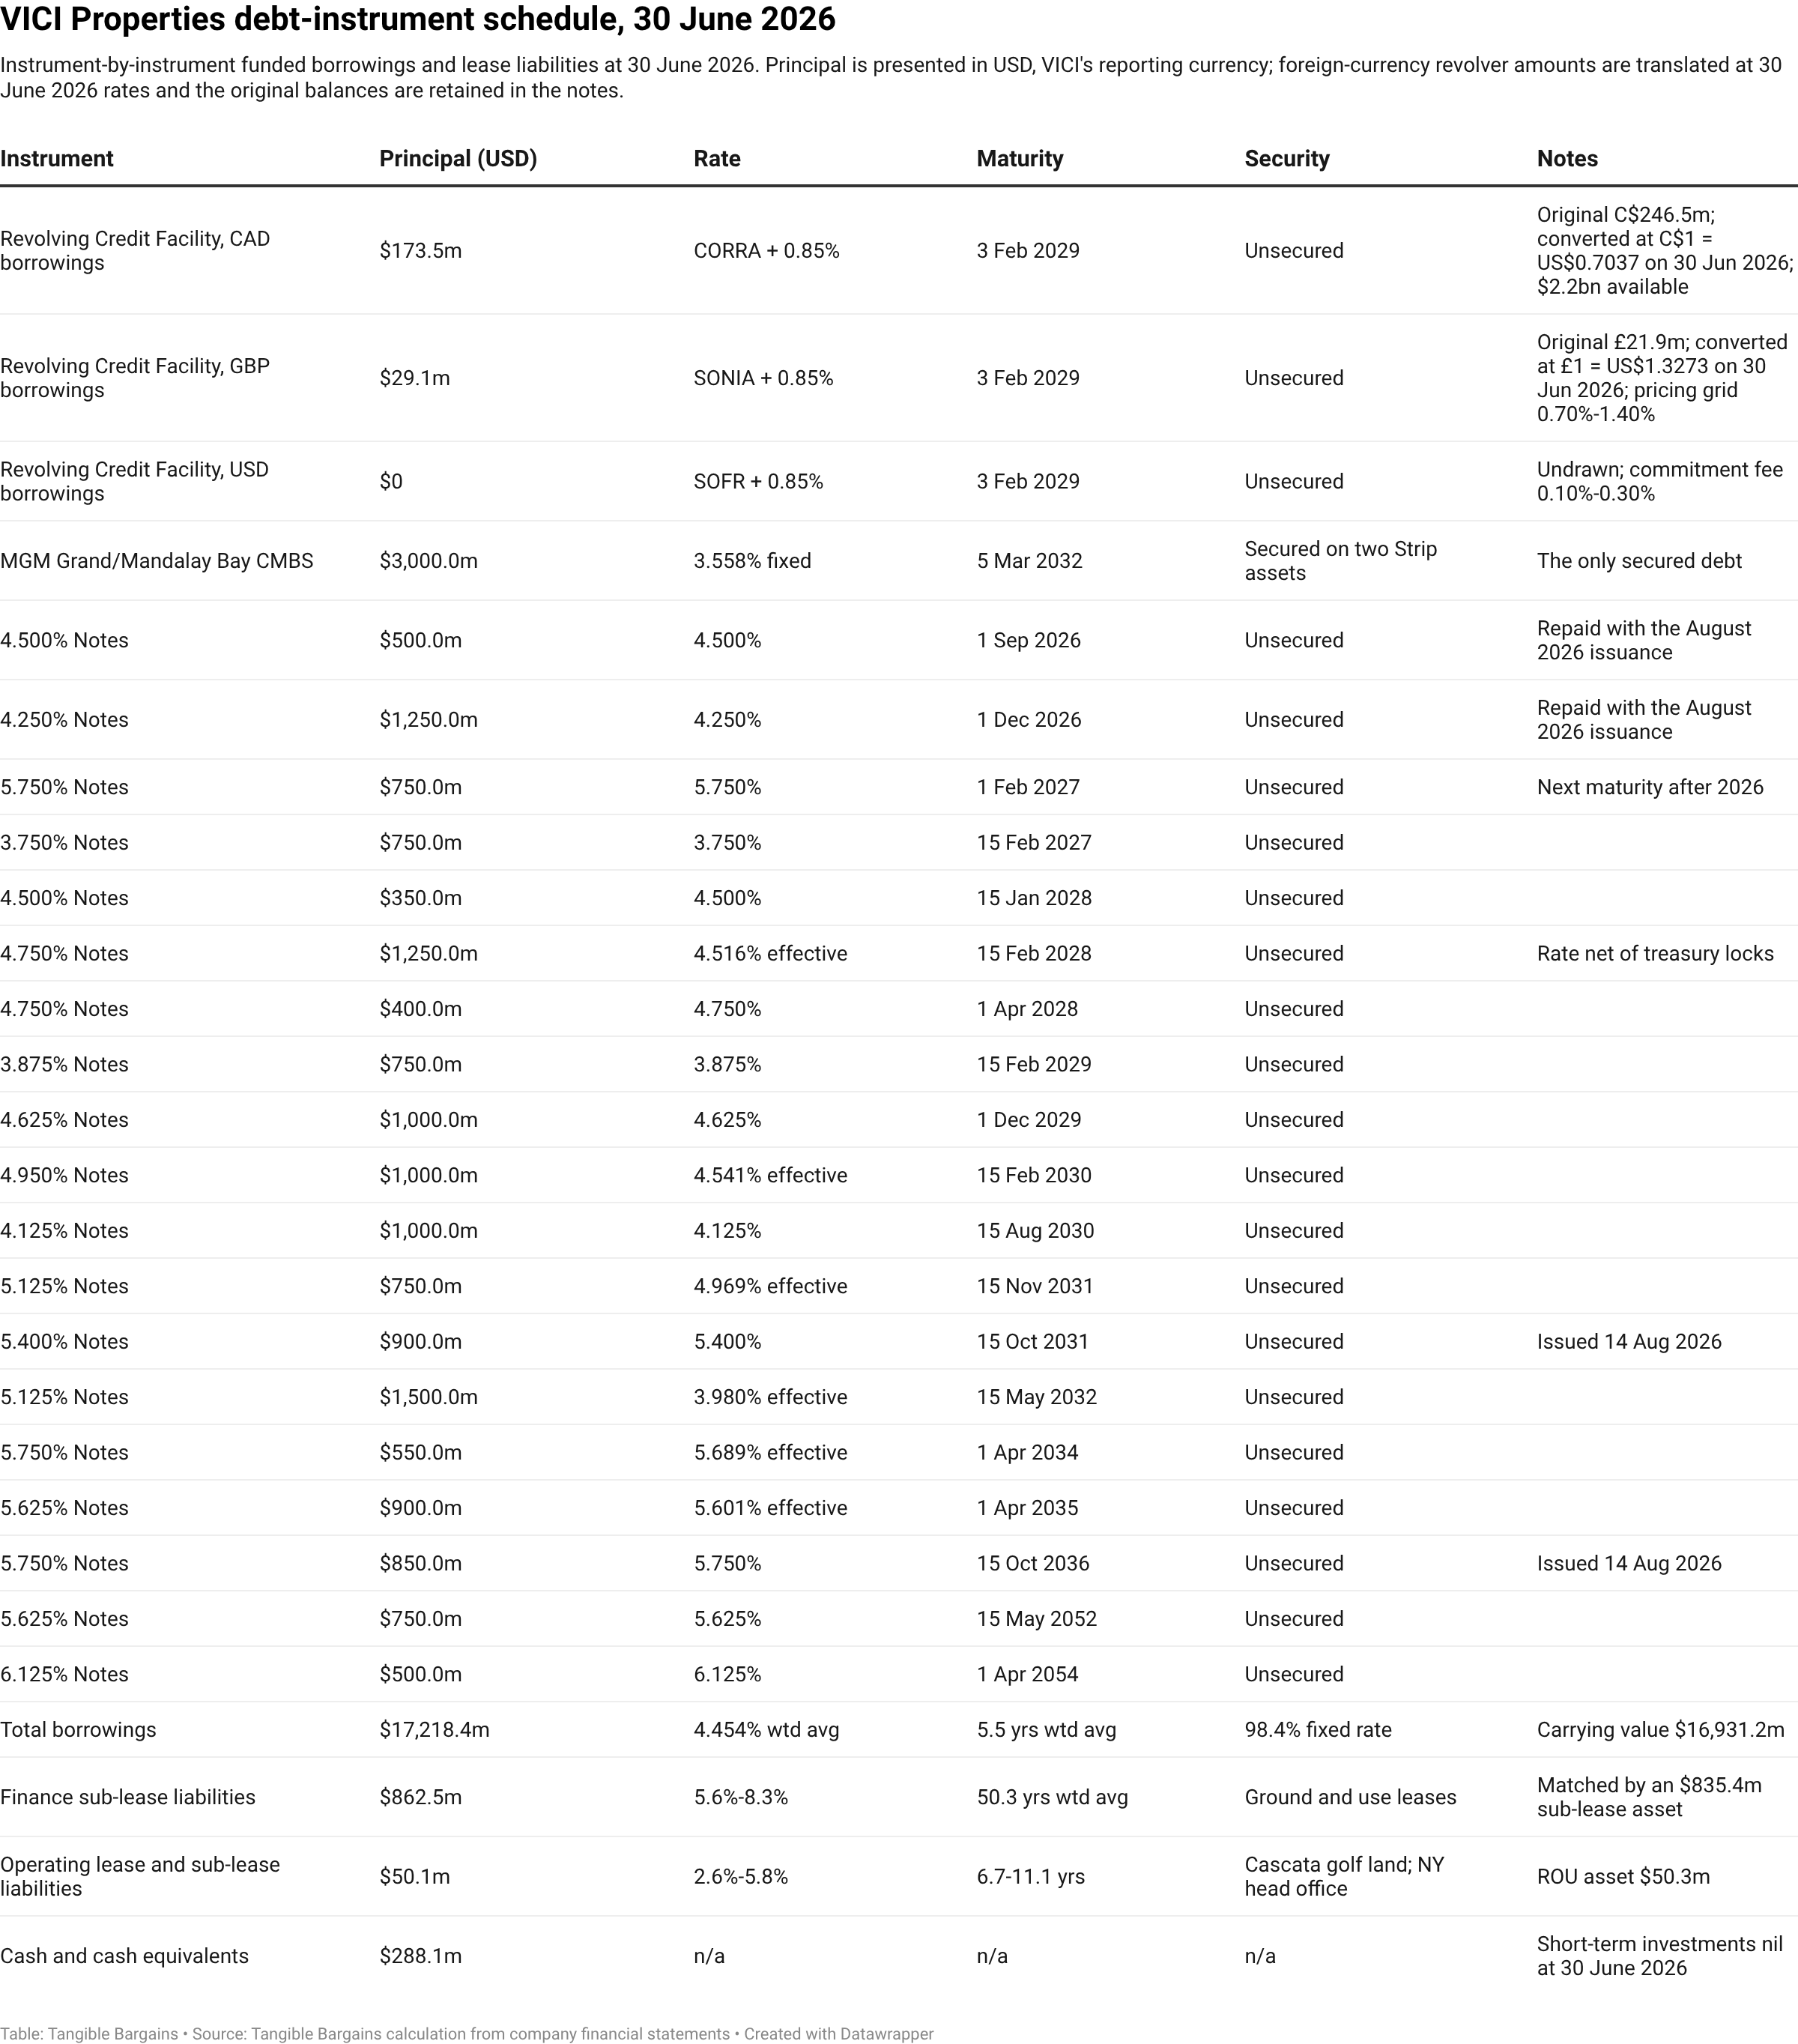
The capital structure is unusually simple for $17 billion of borrowings: one secured mortgage financing, one revolver, and eleven series of senior unsecured notes. The schedule below runs instrument by instrument at 30 June 2026 unless stated otherwise

:
Disaggregation before classification. Financial borrowings are $16,931.2 million of carrying value and $17,218.4 million of principal. Lease liabilities of $912.5 million are a separate bucket and are not promoted into the debt test: $862.5 million is finance sub-lease liability on ground leases whose rent VICI’s own tenants pay directly to the primary landlord, offset by an $835.4 million sub-lease asset. On the governing measure, financial borrowings are 58.0% of the $29,170.7 million of common equity; including lease liabilities, 62.2%; total liabilities of $18,668.5 million are 64.0%. All three are inside the 100% ceiling I use, so the debt screen passes on any reading. No current ratio can be computed: the balance sheet is unclassified: so the liquidity check runs on $2.5 billion of total liquidity instead.
Maturity wall and refinancing. The 2026 wall of $1,750.0 million has already been dealt with. On 5 August 2026 VICI agreed to sell $900.0 million of 5.400% notes due 15 October 2031 at 99.966 and $850.0 million of 5.750% notes due 15 October 2036 at 98.375; on 14 August 2026 the offering closed under a fifth supplemental indenture, roughly $1.72 billion of net proceeds earmarked to retire $480.5 million of 4.500% notes, $19.5 million of assumed 4.500% MGP notes and the $1,250.0 million of 4.250% notes due December 2026. Exact but not free: a 5.570% blended coupon against the retired 4.321% adds roughly $21.9 million of annual interest, about a cent and a half of AFFO. The next maturity is $1,500.0 million in February 2027, then $2,000.0 million in 2028, $1,892.5 million in 2029 and $2,000.0 million in 2030: laddered, no year above 12% of borrowings.
Coverage and covenants are comfortable. Net debt to annualised second-quarter adjusted EBITDA was 4.9 times at 30 June 2026, below the low end of the company’s own 5.0-to-5.5-times target; interest coverage was 4.1 times against a 1.5-times covenant floor; unencumbered assets to unsecured debt stood at 319% against a 150% minimum. The company states it was in compliance with all financial covenants at 30 June 2026, and the investment-grade tranches have suspended most restrictive covenants, leaving the unencumbered-assets maintenance test as the binding one. Ratings are Baa3 from Moody’s (upgraded from Ba1 in November 2024), BBB− from S&P and BBB− from Fitch, all stable: investment grade at all three, with exactly one notch of cushion.
Balance-sheet risk: Manageable. Financial borrowings are 35.1% of total assets, squarely in the middle of what I’d call an ordinary range, and 98.4% of debt is fixed-rate with a 5.5-year weighted average maturity. Interest coverage of 4.1 times would formally read as Elevated on an industrial-company scale, and I want to state that caveat rather than wave it away: a triple-net REIT collecting contractual rent from investment-grade-guaranteed tenants on 39.6-year leases carries more debt at the same underlying risk than a manufacturer would, which is why three agencies rate this structure investment grade at 4.9-times net leverage. The genuine constraints are the MGM tax protection agreement, which puts a floor rather than a ceiling under leverage, and the single notch of ratings headroom.
8. Real Estate, Leases, and Hidden Assets
Right-of-use assets are $50.3 million, or 0.2% of tangible book value: operating ground and use sub-leases plus the New York head office and the Cascata golf land. Matching liabilities are $50.1 million operating and $862.5 million finance sub-lease, the latter at a 50.3-year weighted average term and 5.6% to 8.3% discount rates, offset by an $835.4 million sales-type sub-lease asset presented gross because VICI is primary obligor on ground leases its tenants pay directly. Undiscounted commitments total $30.3 million, $37.6 million and $2,956.4 million respectively; the fixed-charge burden is $65.2 million a year against $3.3 billion of rent received, about 2%. Right-of-use assets are a capitalised right to occupy, not a liquidation floor, and I’m disclosing that here rather than stripping the asset out of the tangible book value used throughout: removing the asset without its matching liability would be the wrong operation. At 0.2% of tangible book the question is immaterial, so calling this cheap against tangible book value below needs no further qualification.
What the tangible book is made of matters here. Ninety-nine per cent of assets: $47,610.1 million of $48,271.2 million: are the real estate portfolio, but almost none is presented as property: sales-type leases $24,577.4 million, lease financing receivables $19,280.1 million, loans and securities $2,917.3 million, sales-type sub-leases $835.4 million, against only $238.1 million of land, development and operating equipment. Three consequences follow. There is no accumulated depreciation reducing book value, which is why tangible book per share rises rather than erodes. The carrying amounts are amortised cost, so book is a cost anchor, neither a market mark nor a depreciated one. And it is stated net of a $1,925.8 million credit-loss allowance never drawn against.
Hidden value exists but is modest and mostly optional. The most concrete item is approximately 33 acres of undeveloped or underdeveloped land on and adjacent to the Las Vegas Strip, leased to Caesars and carried inside a $148.0 million total land line, which management describes as monetisable as appropriate. Four championship golf courses sit inside $66.9 million of operating property and equipment and generate $39.8 million of revenue at a 33% margin. The embedded growth pipeline is optionality with disclosed pricing rather than hidden value: a call right on the Caesars Forum Convention Center at a 13.0-times multiple, a 7.7% cap rate, exercisable to December 2028, plus rights of first refusal over Flamingo, Paris, Planet Hollywood, Bally’s, The LINQ, Horseshoe Baltimore and Caesars Virginia, and rights of first offer with Canyon Ranch, Lucky Strike, Homefield and Indigenous Gaming Partners. The counterweight is that a 39.6-year weighted average lease term puts reversionary value very far away.
9. Capital Markets Access, Dilution, and Financing Flexibility
Dilution is the central structural cost of this business and it is large. Weighted average diluted shares went 577.1 million (FY2021) to 879.7 million (FY2022) to 1,015.8 million (FY2023) to 1,047.7 million (FY2024) to 1,062.7 million (FY2025), and the point-in-time count reached 1,101,074,906 at 30 June 2026: an 84% increase on the weighted diluted measure in five years. Net issuance was negative in every year: $2,385.8 million, $3,219.1 million, $2,480.1 million, $378.7 million and $375.3 million of gross issuance against tax-withholding repurchases of $1.7 million, $6.2 million, $5.0 million, $5.3 million and $7.2 million. There is no buyback programme and management has said it does not intend to run one while it can lend at 9.5%.
The mechanics are disciplined even if the volume is not. Equity is raised almost entirely through forward sale agreements under a $2.0 billion at-the-market programme established 6 May 2024: 7,835,973 shares were priced in FY2025 at a $32.43 weighted average, and 12,101,372 forward shares settled during FY2025 for $375.7 million. As of 30 June 2026 there were no forward shares outstanding: the last 7,750,000 settled on 29 April 2026 for $242.1 million: and no at-the-market activity occurred in the first half, consistent with management declining to issue below book. The 24.3 million shares issued on 30 April 2026 as Golden Entertainment consideration were acquisition currency at a fixed 0.902 exchange ratio, equally dilutive, and explain most of the 32.3 million-share increase in the half. Overhang is negligible: the Q2 2026 diluted count exceeded basic by 39,531 shares.
The company does not need the capital markets to survive, only to grow. FY2025 operating cash flow of $2,510.0 million covered $1,853.5 million of dividends with $656.5 million to spare and essentially no maintenance capital call; $2.5 billion of total liquidity at 30 June 2026 comprises $288.1 million of cash and $2.2 billion of undrawn revolver to February 2029. The August 2026 bond issue demonstrates unimpaired debt-market access at investment-grade spreads. Dilution risk as a judgment: moderate and self-limiting: the shares can only be issued accretively above book, and below book management has visibly stopped, which protects book value per share but also caps growth precisely when the stock is cheapest.
10. Litigation, Regulatory, and Contingent Liability Risk
Two primary sources were reached in full and both are named. Item 3, Legal Proceedings of the FY2025 annual report states that “As of December 31, 2025, we are not subject to any litigation that we believe could have, individually or in the aggregate, a material adverse effect on our business, financial condition or results of operations, liquidity or cash flows.” Note 10, Commitments and Contingent Liabilities repeats that language verbatim with no accrued loss reserve of any kind, and the corresponding note in the Q2 2026 quarterly report repeats it again as of 30 June 2026. That is boilerplate in form but boilerplate with nothing behind it: no named defendant, no class action, no regulatory proceeding, no tax dispute, no environmental matter anywhere in the annual report.
Negative confirmation (Form 10-K FY2025, Item 3 and Note 10: Commitments and Contingent Liabilities): ordinary-course claims only; no material litigation, investigations or regulatory actions disclosed; no accrued loss reserves.
The prior-disclosure carry-forward check produced nothing to carry. The FY2025 annual report discloses no subpoena, investigation, class action, covenant waiver, going-concern language or material weakness; the auditor issued unqualified opinions on both the financial statements and internal control over financial reporting. The Q2 2026 quarterly report contains no subsequent-events note and no going-concern language: every report page in that filing was checked to confirm the absence rather than infer it. The honest caveat is that a clean two-period record is weaker confirmation than a clean five-period one: the FY2023 and FY2024 annual reports were read for their financial statements, not their legal-proceedings items.
What can take a bite out of tangible book is contractual rather than litigious. Future funding commitments on the debt book were $623.5 million at 31 December 2025, subject to borrower covenant compliance, plus $55.2 million for the Club Med redevelopment. The MGM tax protection agreement indemnifies MGM against tax liabilities triggered by disposal of a protected property, by a transaction requiring exchange of MGM’s partnership interests, or by failure to maintain approximately $8.5 billion of non-recourse indebtedness allocable to MGM, for fifteen years from April 2022: uncapped and unquantified, constraining both asset sales and deleveraging, with a separate agreement to mid-2029 covering built-in gain on MGM Grand and Mandalay Bay. Ground and use lease obligations total $2,956.4 million undiscounted, for which VICI is primary obligor even though tenants pay the landlord directly. The $82.8 million non-accrual loan is the only disclosed impaired asset.
Regulatory exposure is real but second-order. VICI is not a gaming operator, but it holds licences or findings of suitability where its tenants operate, so a licensing problem at a tenant is a rent problem here. The larger dependency is tax: at least 90% of REIT taxable income must be distributed and the asset and income tests satisfied, and failure would expose the company to corporate tax at regular rates: managed by paying out 73% of AFFO and housing golf in a taxable REIT subsidiary. Item 1 flags that prediction markets and similar platforms currently operate under federal rather than state regulation, giving them an advantage over licensed tenants; that is a slow-acting threat to tenant economics rather than a contingent liability, and it is carried into the risk list below as such.
11. Accounting Quality and Disclosure Review
The auditor is Deloitte & Touche LLP, in place since 2016, and the FY2025 opinions are unqualified on both the consolidated financial statements and on internal control over financial reporting, each dated 25 February 2026. There is no going-concern paragraph, no material weakness, no restatement in the period reviewed, and management’s own conclusion agrees. Separate audited statements are issued for VICI Properties L.P. inside the same annual report, with the same opinions.
There is exactly one critical audit matter, and it is the right one: the allowance for credit losses. The auditor describes a discounted-cash-flow model projecting expected losses from probability-of-default and loss-given-default inputs drawn from a third-party provider, keyed over a two-year window to the current condition of tenants and their parent guarantors and thereafter to historical default and loss rates of comparable public companies. The procedures disclosed are substantive: controls over the model and its data were tested, credit specialists evaluated the methodology and assumptions, the credit rating and equity value of each guarantor were agreed to independent data, and cash-flow inputs were reconciled to the contracts. That last step matters, because the Q2 2026 charge arose from exactly such a data change.
Revenue recognition is the second area of judgment and is structural rather than discretionary. Whether a lease is classified as sales-type or as a financing receivable at inception determines whether cash rent arrives as interest accretion or as rent, and it is why $523.9 million of FY2025 revenue never became cash. The classification is made once, on the economics of the contract, and is disclosed, consistent and reconciled in the cash-flow statement. Non-GAAP presentation is disciplined: funds from operations and adjusted funds from operations, with add-backs named and traceable: non-cash lease accretion (a deduction, the conservative direction), the credit allowance, debt-issuance-cost amortisation, stock compensation and transaction costs. Only the $7.7 million of transaction expenses is genuinely non-recurring, and the rest are labelled as recurring.
Impairment risk to book value is nil from the usual source. There is no goodwill and no intangible asset on the balance sheet in any period, so no part of tangible book is exposed to a write-down; the analogous exposure is the credit allowance, already deducted. Deferred tax assets of $10.5 million are immaterial for a REIT that paid $7.3 million of cash tax in FY2025, and no pension obligation is disclosed. Segment reporting is thin but adequate: real property and golf, the latter 1% of revenue: supplemented by tenant-level rent disclosure. Related-party disclosure is where the annual report is quietest: no related-party note at all, with the proxy’s substance being a policy and a negative statement rather than a schedule.
Disclosure quality: Adequate. Unqualified opinions with no material weakness and near-full primary verification would support a stronger rating but for two things: the sole critical audit matter is a genuine and large estimation-risk area whose output moved reported earnings by $271.1 million in a single quarter, and the proxy’s compensation tables and audit-fee schedule were not reached in full. Neither is a concern about integrity; both are reasons not to claim the top rating.
12. Valuation and Margin of Safety
Tangible book value, derived from the 30 June 2026 balance sheet. Common shareholders’ equity was $29,170.7 million (Form 10-Q Q2 FY2026). VICI carries no goodwill and no other intangible assets in any period since formation, so tangible book value equals common equity exactly: $29,170.7 million. Dividing by the 1,101,074,906 shares issued and outstanding at 30 June 2026 (a point-in-time count, not a weighted average: no filing-supported dilutive increment exists at that date, and the Q2 2026 diluted count exceeded basic by only 39,531 shares) gives $26.4930 per share. The only non-tangible deferred charges anywhere are $14.5 million of unamortised revolver financing costs and $6.8 million of deferred acquisition costs, together $0.02 per share, which would move the multiple from 0.968× to 0.969× if backed out: immaterial, and not applied. The $431,962 thousand of non-controlling interest is excluded by construction: the valuation uses equity attributable to VICI’s own shareholders, not the consolidated total.
P/TBV (derived) = $25.65 ÷ $26.4930 = 0.968× (price as of 2026-09-03).
At the 30 June 2026 anchor, cash and short-term investments were $288.1 million (1.0% of tangible book), accounts receivable $34.2 million (0.1%), owned property, plant and equipment $238.1 million (0.8%), right-of-use lease assets $50.3 million (0.2%, disclosed and never stripped from the figure above), and long-term investments: the bulk of the real estate portfolio, held as leases and loans rather than owned property: $47,610.1 million, or 163.2% of tangible book against 98.6% of total assets. There is no goodwill and no intangible balance in the mix. Total assets were $48,271.2 million.
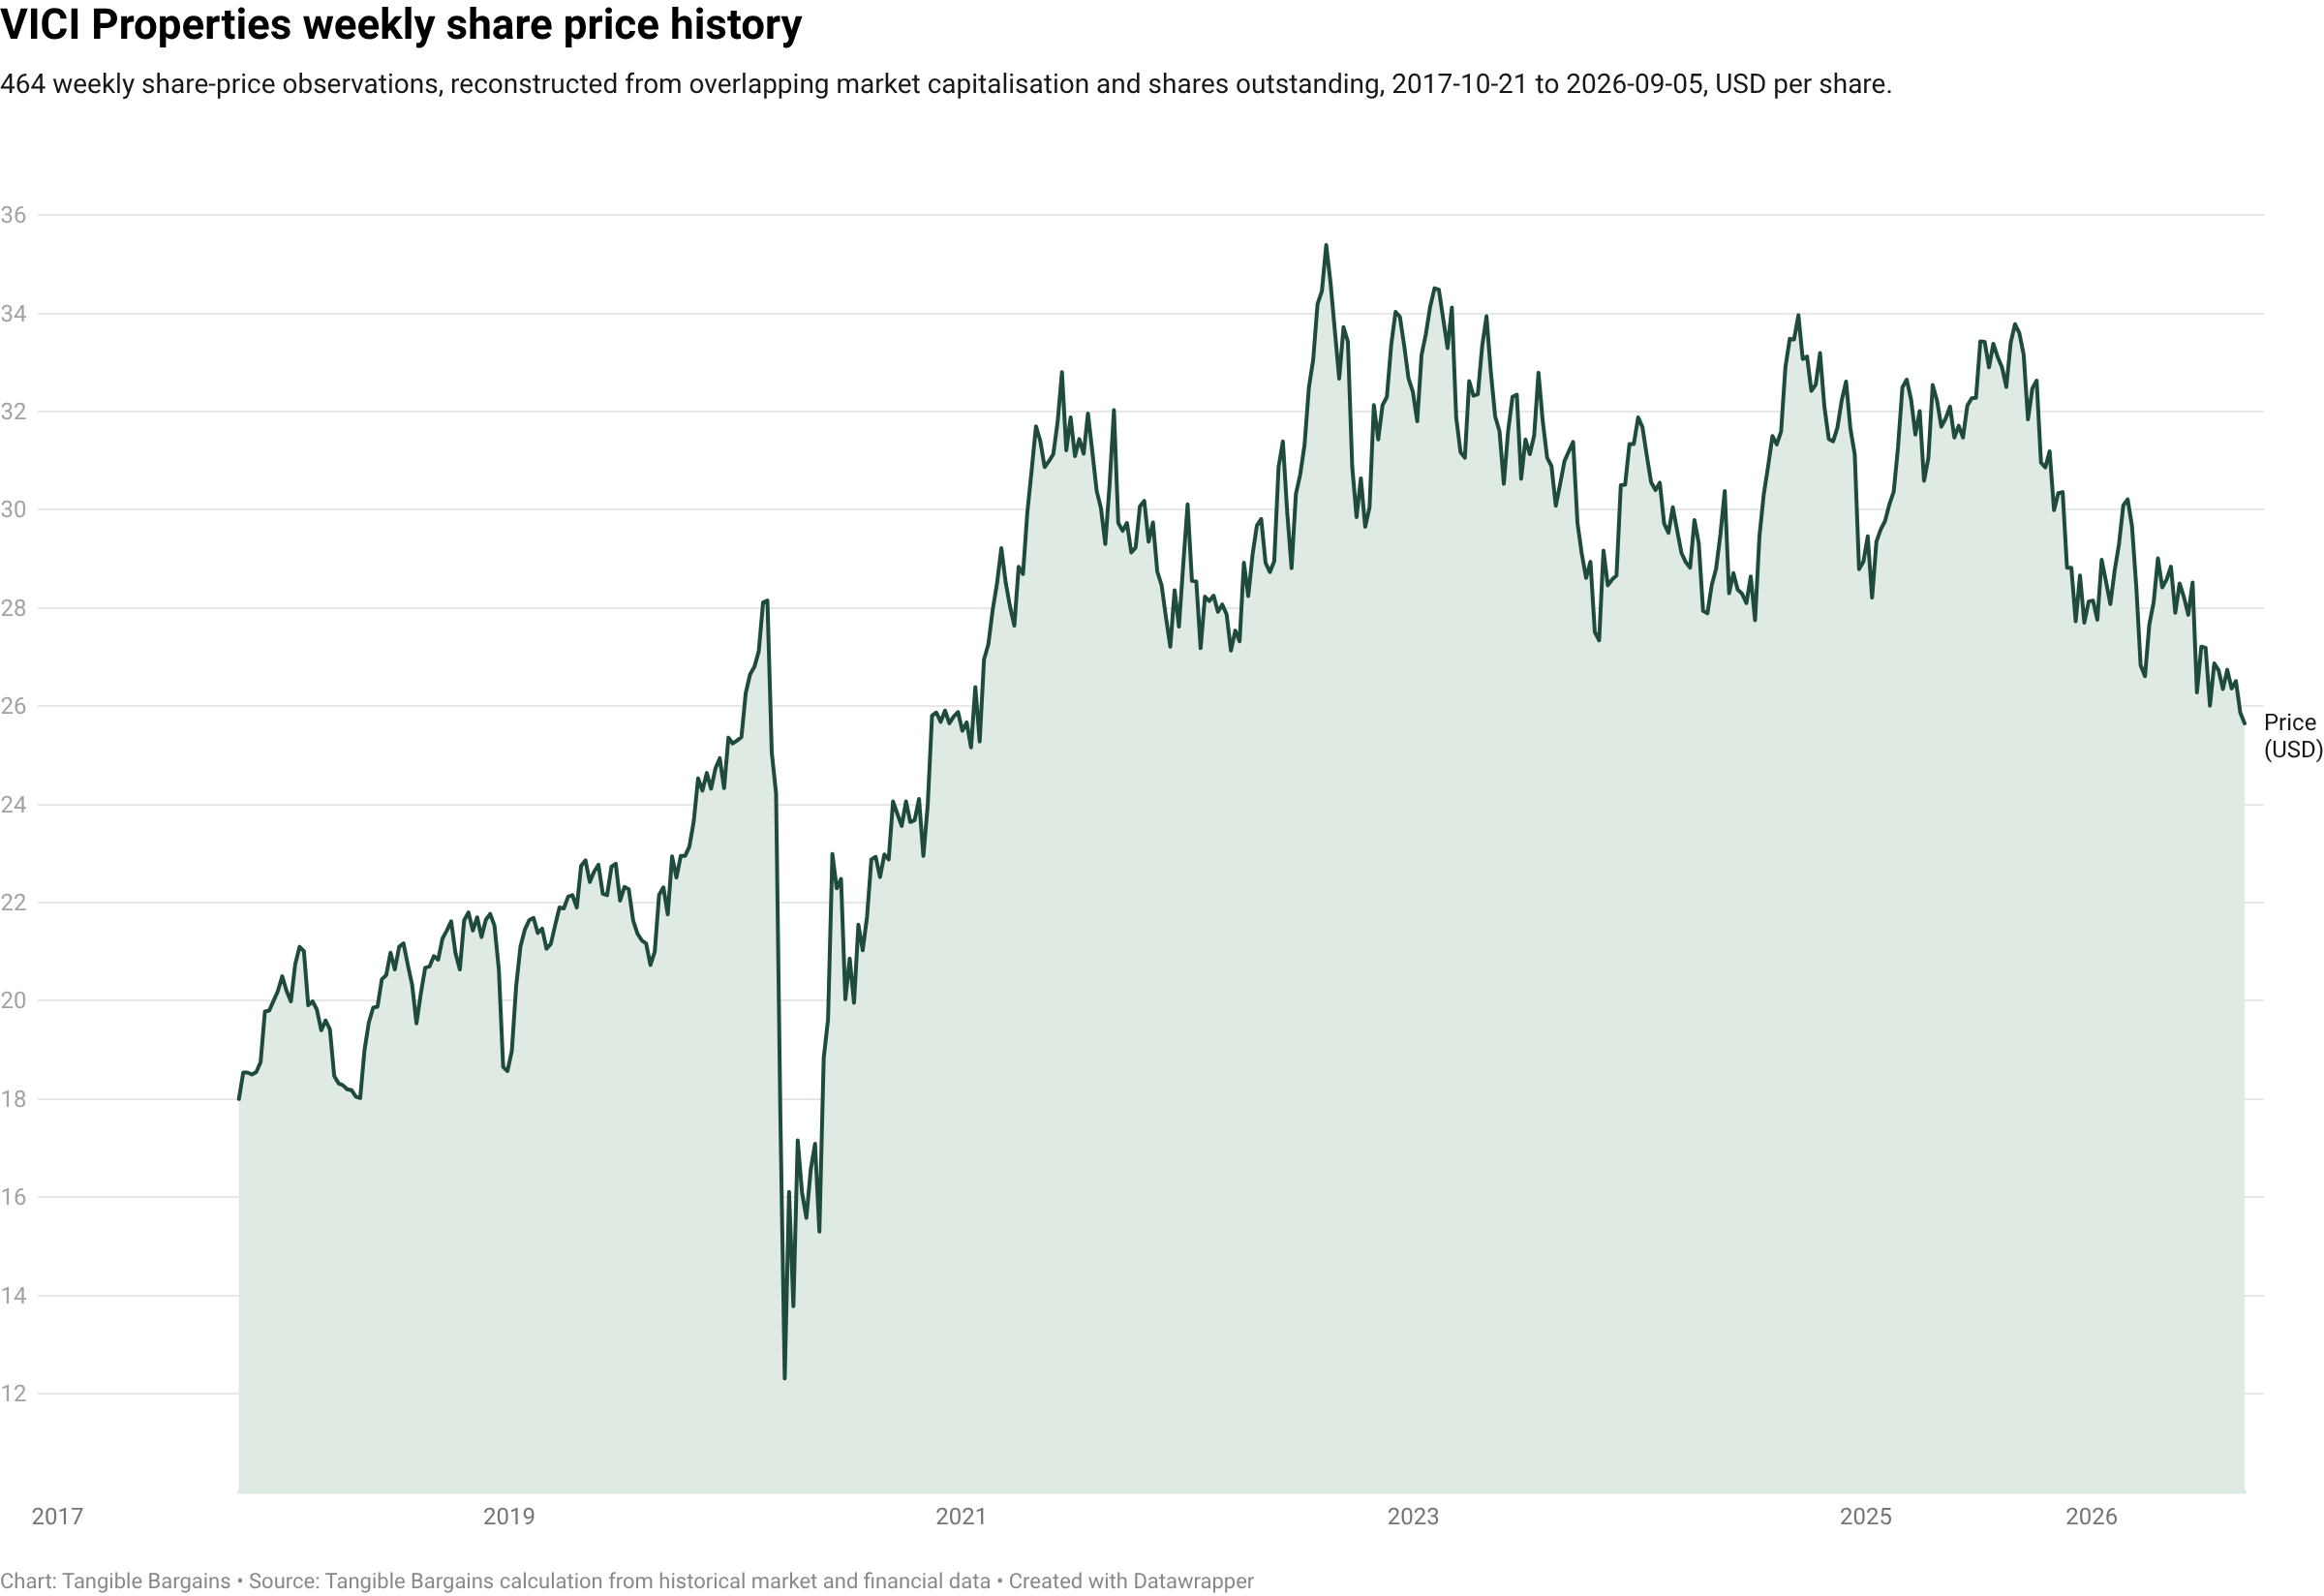
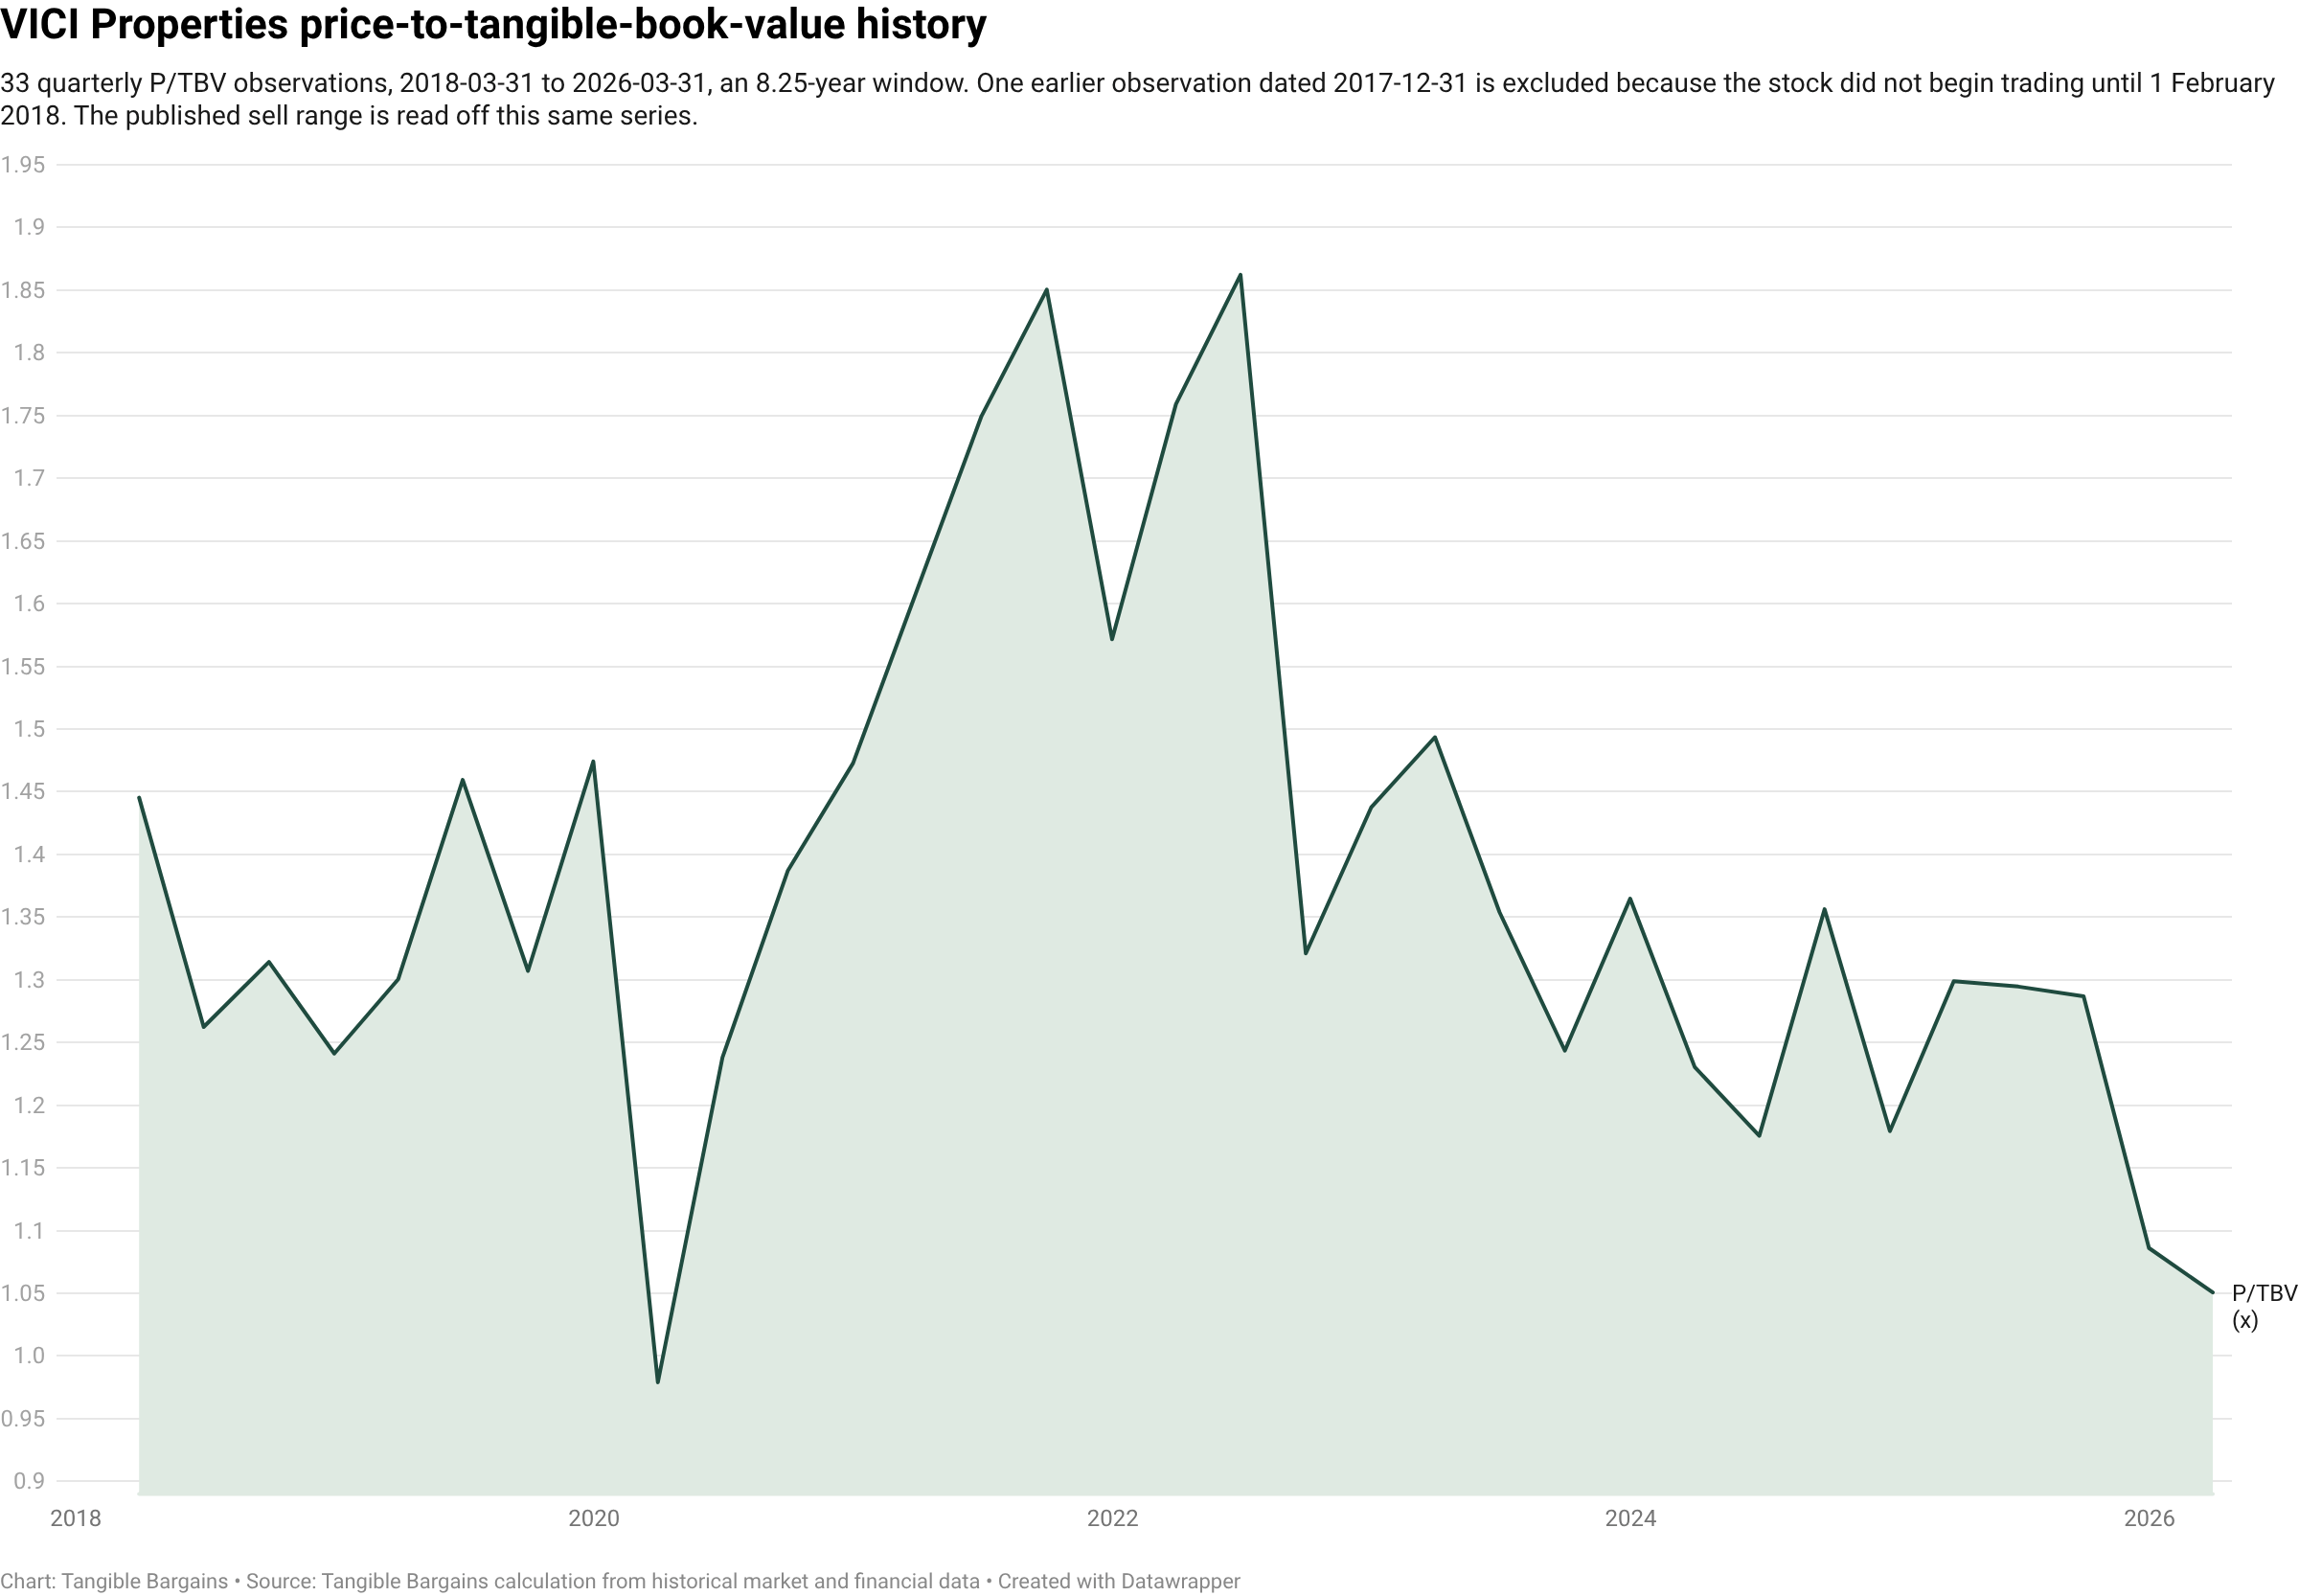
Historical relative multiple valuation. The book-value leg is the primary anchor and rests on 33 quarter-end P/TBV observations from 2018-03-31 to 2026-03-31, an 8.25-year window
.
One further observation, dated 2017-12-31, is excluded from that window: the common stock did not begin trading on the New York Stock Exchange until 1 February 2018, so no traded price stands behind it, and the 74.17× multiple carried there is arithmetically impossible against the equity then reported. Leaving it in would have dragged the top-quartile mean to 9.73× and produced a sell range topping $257 per share; the exclusion is disclosed here rather than buried and is the only edit made to the series. On the book-value leg, the stock sits at 0.968× against a window whose floor is 0.979× (March 2020) and whose ceiling is 1.862× (June 2022), with a typical band of 1.243× to 1.473× implying $32.94 to $39.02 a share. On trailing GAAP earnings the stock trades at 9.9 times, below the five-year floor of 10.8× (FY2025) and well under the 10.8×-to-13.4× typical band excluding the CECL-distorted FY2022 print of 25.8×, implying $27.86 to $34.57 a share. On funds from operations the multiple is 10.8× FY2025 adjusted funds from operations of $2.38 per share, with no multi-year window sourced for comparison. The implied capitalisation rate on annualised contractual rent is 7.76% at today’s price.
The two legs agree and need no averaging: on book value the stock sits below the floor of its own eight-year window, and on earnings below the lowest annual observation in five years. Today’s 0.968× is at the 0th percentile of the 33-observation distribution: cheaper than at any quarter-end since listing, including the March 2020 pandemic low of 0.979×. Where they diverge is magnitude: the book leg implies $32.94 to $39.02 on a return to the typical band, the earnings leg $27.86 to $34.57, the difference being dilution. The reconciled demonstrated range is $28 to $39. The 8.25-year P/TBV history behind this window is a market-data series that has not been independently rebuilt point by point against filings; the current-period P/TBV used throughout this report is derived directly from the balance-sheet bridge above.
Sell range. This method sets the sell range from the median and the top-quartile mean of the stock’s own P/TBV distribution, applied to current tangible book per share, giving $35.00 to $43.70 (1.321× to 1.649× tangible book) on the 33-observation, 8.25-year quarterly window. The distribution: minimum 0.979×, p25 1.243×, median 1.321×, p75 1.473×, p90 1.722×, maximum 1.862×. The flat 0.80× reference of $21.19 is fallback only, not the rule for this name. The range begins 36% above today’s price.
An exit at the low end, around $35, is the reasonable expectation, for a returns reason rather than a preference. The top-quartile multiples in this series were printed between mid-2021 and mid-2022, when VICI was adding rent at more than 70% a year through the MGP and Venetian acquisitions and funding it at a sub-4% marginal cost of debt. Today rent grows at roughly 3% from escalators plus incremental deals, and the marginal cost of debt is the 5.570% blended coupon struck in August 2026. The multiple a 3%-growth business earns is the middle of its own distribution, not the top. Return on common equity was 10.0% in FY2025 against an 8.7% five-year average, so nothing in the credibility of the return argues for a lower band: but the growth that earned the ceiling is absent.
Scenario table. The lens is net asset value on capitalised rent, cross-checked against the tangible-book apparatus. Every case uses one formula: NAV per share = [ annualised contractual rent ÷ capitalisation rate + loans and securities, net + cash − total borrowings at principal − non-controlling interests ] ÷ 1,101.075 million shares, where the constant deduction is $17,218.4m − $2,917.3m − $288.1m + $432.0m = $14,445.0 million. Land, development property and operating equipment of $238.1 million are excluded entirely, and the $862.5 million finance sub-lease liability is netted against its matching $835.4 million asset and dropped; both omissions are conservative.
Severe downside: Caesars rent reset −20% to $3,063.0 million, cap rate widens to 8.75% → $18.67, −27.2%.
Bear: Caesars rent reset −10% to $3,187.6 million, cap rate 8.25% → $21.97, −14.3%.
Base: rent as reported, $3,312.2 million, cap rate 7.75% → $25.70, +0.2%.
Bull: rent +2.5% to $3,395.0 million from escalators and new deals, cap rate 7.00% → $30.93, +20.6%.
Anchor, tangible book: the derived filing bridge at 30 June 2026 → $26.49, +3.3%.
Anchor, own-history p25 multiple: 1.243× tangible book on the 8.25-year window → $32.94, +28.4%.
Two cross-checks. The cap-rate anchors are not invented: VICI’s own call right on the Caesars Forum Convention Center is struck at a 13.0-times multiple, a 7.7% cap rate, and FY2025 commitments were made at an 8.9% weighted average initial yield, so 7.00% to 8.75% brackets both the trophy and the regional end of the portfolio. Separately, a book-value stress rather than a value estimate: were the credit allowance to double to $3,851.6 million: no precedent, given zero charge-offs since inception: tangible book would fall to $24.74 per share and today’s price would be 1.037× tangible book rather than 0.968×.
Stated explicitly. Current price $25.65 at the 3 September 2026 close, a market capitalisation of approximately $28.2 billion on 1,101,074,906 shares; the stock traded at $25.42 intraday on 4 September 2026, within $0.08 of a 52-week low of $25.34. The reporting currency is the US dollar throughout. The debt exhibit translates the CAD and sterling revolver balances into USD at 30 June 2026 rates of C$1 = US$0.7037 from the Bank of Canada and £1 = US$1.3273 from the Bank of England; the original balances remain in the exhibit notes. Intrinsic value range: $25.70 to $29.85 per share, the base-case net asset value at capitalisation rates of 7.75% down to 7.00%, with derived tangible book of $26.49 inside it. Margin of safety: 3.2% against tangible book per share and 7.7% against the $27.78 midpoint: thin on both, and the discount that exists is to the stock’s own history, not to its assets.
Buy-Below is $26.49, 1.00× tangible book: and it’s worth publishing why, rather than picking whichever number looks better. This method normally sets Buy-Below from the stock’s own trading history: the average of every quarter at or below the 25th percentile of its P/TBV range, which for VICI is 1.158× tangible book, or $30.68. That figure ordinarily sits safely below the sell range, and it does here too ($30.68 against a $35.00 floor). But VICI has never traded below tangible book in eight years until now, so its own lower quartile sits above 1.00×: and publishing $30.68 as the buy price would invite a purchase at 1.16× tangible book, a level at which this method’s own cheapness screen fails and the call would be Avoid, not Buy. The lower number governs instead: $26.49, the price at which the stock stops qualifying as cheap against its own book value at all. Buy More Below, where I’d move the position from Small to a larger size, is $21.19, 0.80× tangible book.
Cheapness type: asset-value cheap, with a statistical overlay. The assets behind the book value carry no accumulated depreciation and are already stated net of a $1,925.8 million credit reserve never drawn. Paying below book for a portfolio 100% leased on a 39.6-year weighted average term with parent guarantees from two S&P 500 operators is an asset-value proposition first; the overlay is that the portfolio has never been available at this multiple before. What it is not is a high-quality-compounder discount: the company cannot compound internally: nor a deep Schloss-style asset discount, since the margin against a real-world net asset value is single-digit. The risk of value-trap cheapness turns on one question: whether the Caesars rent funding 38% of the roll survives a change of control intact.
13. Risk Matrix
Caesars rent reset on the Fertitta change of control: High severity, Medium probability. Caesars agreed on 28 May 2026 to a take-private by Fertitta Entertainment; it provides 38% of annualised rent ($1,246.2 million), and management gave no timeline for the lease discussions on the Q2 2026 call. A 10% reset costs about $124.6 million of rent, roughly $0.11 of AFFO per share; the bear case above is −14%. Mitigants: a parent guarantee, master-lease cross-default, and a 100% collection record since 2017. Watch any 8-K amending a Caesars lease and the Fertitta deal’s regulatory timetable.
Tenant concentration: High severity, Low probability. Caesars and MGM are 38% and 32% of the $3,312.2 million rent roll, and the Las Vegas Strip is 49% of FY2025 lease revenue. A single master-lease default would remove a third of revenue; the severe-downside case above is −27%. Mitigants: parent guarantees from two S&P 500 operators, and sixteen tenants now versus twelve two years ago. Watch tenant rent-coverage disclosure and both companies’ credit ratings.
Credit-loss allowance volatility: Medium severity, High probability. The allowance moved $271.1 million in a single quarter (Q2 2026) and stands at $1,925.8 million, 3.84% of amortised cost, the auditor’s sole critical audit matter. It is non-cash but drives reported earnings and book value directly; doubling the reserve would take tangible book per share to $24.74. Mitigants: zero charge-offs and zero recoveries since adoption, and inputs agreed to independent data by the auditor. Watch the quarterly roll-forward and guarantor rating changes.
Rising cost of debt on refinancing: Medium severity, High probability. The August 2026 issue priced at a 5.570% blended coupon against 4.321% retired, roughly $21.9 million of extra annual interest; $1,500.0 million matures in February 2027 and $2,000.0 million in 2028. This compresses AFFO growth toward the low single digits. Mitigants: 98.4% fixed-rate debt, a 5.5-year weighted average maturity, and $2.2 billion of undrawn revolver capacity to 2029. Watch the February 2027 maturity and credit spreads at each new issue.
Single-notch investment-grade rating: Medium severity, Low probability. Ratings are Baa3/BBB−/BBB−, all stable, with net leverage at 4.9× against a 5.0-to-5.5× target. A downgrade would widen spreads across $17.2 billion of borrowings and raise the capitalisation rate the market applies to the rent. Mitigants: leverage already below target, and unencumbered assets at 319% of unsecured debt against a 150% covenant. Watch agency actions after any Caesars lease amendment.
Equity-funded growth stalling below book: Medium severity, High probability. Shares outstanding are up 75% since FY2021 and there was no at-the-market issuance in the first half of 2026, with the stock at 0.968× tangible book. External growth pauses, and AFFO growth falls back to the contractual escalator, removing the growth premium in the historical median multiple. Mitigants: escalators alone deliver about 3% a year without new capital, and the $2.9 billion credit book yields 9.1%. Watch at-the-market usage each quarter and new investment yields.
Non-accrual and future funding exposure in the credit book: Low severity, Medium probability. An $82.8 million golf-resort loan has been on non-accrual since Q4 2025, and $623.5 million of future funding commitments existed at 31 December 2025 plus $55.2 million for Club Med. The loan is 0.17% of amortised cost and the committed funding is 3.6% of borrowings, immaterial unless it becomes a pattern. Mitigant: the loan is fully funded and senior secured. Watch for any further non-accrual designation and the recapitalisation outcome.
MGM tax protection agreement: Low severity, Low probability. The agreement requires roughly $8.5 billion of non-recourse debt allocable to MGM to be maintained for fifteen years from April 2022, an uncapped and unquantified indemnity if breached, constraining deleveraging and asset sales. Mitigants: the required balance declines over the term and no breach is disclosed. Watch any disposal of a protected property.
Long-dated escalators against replacement cost: Low severity, Medium probability. The weighted average lease term is 39.6 years including options, with escalators of 1% to 2% fixed or CPI-linked with caps. Persistent inflation above the caps would erode real rent and lower the terminal value in any net asset value estimate. Mitigant: 42% of FY2025 rent, and roughly 90% over the long term, is CPI-linked. Watch the realised escalator against CPI each year.
14. Red Flags, Yellow Flags, and Green Flags
🟢 Green Flags
Tangible book value per share has risen every year: $19.25 (FY2021), $22.77, $24.22, $25.12, $26.01 (FY2025) and $26.49 at 30 June 2026: despite a 75% increase in share count, because equity was issued above book and invested at an 8.9% weighted average initial yield in FY2025.
Zero charge-offs and zero recoveries against the credit-loss allowance in FY2023, FY2024, FY2025 and H1 2026, on a reserve grown from $1,368.8m to $1,925.8m.
Unqualified audit opinions on the financial statements and on internal control over financial reporting for FY2025, from an auditor in place since 2016, with no material weakness and no restatement.
The 2026 maturity wall of $1,750.0m was refinanced in full on 14 August 2026 through $900.0m of 5.400% notes due 2031 and $850.0m of 5.750% notes due 2036.
Dividend raised in every year of the company’s public life, most recently to $0.46 a quarter, on a 73% AFFO payout.
Zero governance red flags fired, with all seven directors elected annually by majority vote on 28 April 2026 and 94.9% say-on-pay support.
🟡 Yellow Flags
GAAP net income has exceeded operating cash flow in every year reviewed: by $265.5m in FY2025: and $1,848.9m of non-cash lease accretion since FY2023 is the largest component of the $3,189.4m retained-earnings balance.
No insider bought a share on the open market in the twelve months to July 2026, with the stock at a 52-week low; every Form 4 is a grant or a tax-withholding surrender.
Four named executives account for roughly $31m of a $65.1m general and administrative line at a 28-employee company.
The credit-loss allowance is a third-party model output whose inputs changed enough in one quarter to move reported earnings by $271.1m, and it is the auditor’s sole critical audit matter.
VICI is simultaneously landlord, lender and prospective buyer to Cabot, which also manages all four of its golf courses.
The proxy’s compensation tables and audit-fee schedule were not reached in full.
🔴 Red Flags
Caesars, source of 38% of annualised rent, agreed on 28 May 2026 to be taken private by Fertitta Entertainment in a transaction assuming approximately $11.9bn of Caesars debt, and management declined on 30 July 2026 to give any timeline for the associated lease discussions: the one disclosed negotiation that can permanently reset a third of the rent roll.
Caesars reported a Q2 2026 GAAP net loss of $62m and consolidated Adjusted EBITDA of $920m against $955m a year earlier, so the largest tenant is deteriorating operationally while its ownership changes.
The first credit event in the company’s history occurred in Q4 2025: an $82.8m senior secured loan on a luxury golf-resort development placed on non-accrual, the borrower seeking recapitalisation.
Investment-grade ratings sit exactly one notch above high yield at all three agencies, with no second notch of cushion, against $17.2bn of borrowings.
⚡ Must-Watch Catalysts
Q3 2026 results, expected late October 2026, with the next credit-allowance roll-forward.
Any 8-K amending the Caesars Las Vegas or Caesars Regional master leases, and the regulatory timetable for the Fertitta acquisition of Caesars.
The $1,500.0m of senior notes maturing February 2027 and the terms on which they are refinanced.
Dividend payment on 8 October 2026 to holders of record 17 September 2026, and the December 2026 declaration.
Resumption or continued absence of at-the-market equity issuance in each quarterly equity note.
Recommendation
Verdict: BUY — SMALL
At $25.65, VICI trades at 0.968× tangible book value of $26.4930 per share (30 June 2026) and clears both of my absolute screens: price-to-tangible-book at or under 1.00×, and financial borrowings at 58.0% of common equity, well inside the 100% ceiling I use (62.2% including lease liabilities, 64.0% on total liabilities). The Piotroski F-Score is 5 of 7 computable signals, Eligible, with both failures explained by ordinary lease accounting rather than a real problem. Normalized P/E is 10.8× on FY2025 adjusted funds from operations of $2.38 per share. Cash return is 7.2%, all dividend, with no buyback programme.
Intrinsic value range: $25.70 to $29.85 a share, net asset value on capitalised contractual rent at cap rates of 7.75% down to 7.00%, with derived tangible book of $26.49 inside that range.
Margin of safety: 3.2% below tangible book per share, 7.7% below the $27.78 midpoint of the intrinsic range: real, but thin.
Buy-Below: $26.49, 1.00× tangible book (see the note above on why the own-history figure of $30.68 isn’t the published number here).
Buy More Below: $21.19, 0.80× tangible book, where I’d move the position from Small to Standard.
Sell range: $35.00 to $43.70, 1.321× to 1.649× tangible book, from 33 quarterly observations over 8.25 years. The flat 0.80× fallback of $21.19 is not the rule for this name. I’d expect an exit nearer the low end, around $35, because the top-quartile multiples in this series were earned on rent growing more than 70% a year during the MGP and Venetian acquisitions, a pace nothing in the current portfolio replicates.
Position size: Small.
Expected holding period: Three to five years, long enough for the Caesars change of control to resolve and for the multiple to revert toward its own median.
Downside risk: −14.3% ($21.97) on a 10% Caesars rent reset; −27.2% ($18.67) in the severe case.
Balance-sheet risk: Manageable. Borrowings are 35.1% of total assets, 98.4% fixed-rate, with a 5.5-year weighted average maturity. Interest coverage of 4.1× would read as Elevated on an industrial scale, but a triple-net REIT collecting contractual rent from investment-grade-guaranteed tenants on 39.6-year leases can carry more debt at the same underlying risk, which is why three rating agencies call this structure investment grade at 4.9× net leverage.
Creditworthiness: Baa3 (Moody’s), BBB− (S&P), BBB− (Fitch), all stable, investment grade at all three but with exactly one notch of cushion. Net leverage is 4.9× against a 5.0-to-5.5× target, and unencumbered assets cover unsecured debt 319% against a 150% covenant.
Governance risk: Low, none of the five red flags I check fired.
Accounting quality: Adequate. Unqualified audit opinions on both the statements and internal controls, no material weakness, one genuine estimation-risk item (the credit-loss allowance).
Refinancing risk: Low near term. The 2026 maturity wall was retired in full with the 14 August 2026 bond issue; the next maturity is $1,500.0 million in February 2027 against $2.2 billion of undrawn revolver capacity to 2029.
Key catalysts: resolution of the Caesars lease discussions and the Fertitta change of control; Q3 2026 results in late October; the February 2027 maturity; resumption of accretive equity issuance if the shares recover above tangible book.
What would break the thesis: a permanent cut to Caesars rent on the change of control; a downgrade below investment grade; a genuine credit loss in the master-lease portfolio, which has never happened; or sustained equity issuance below tangible book.
What to watch
Any 8-K amending the Caesars Las Vegas or Caesars Regional master leases, and the closing timetable for the Fertitta take-private of Caesars agreed 28 May 2026.
Caesars’ own quarterly results and rent coverage; consolidated Adjusted EBITDA fell to $920m in Q2 2026 from $955m.
The quarterly credit-loss allowance roll-forward: the first charge-off in the company’s history would be a thesis event, not a modelling event.
The $82.8m golf-resort loan on non-accrual since Q4 2025 and whether its recapitalisation closes.
The $1,500.0m of senior notes maturing February 2027 and the coupon at which they are refinanced.
Ratings actions at Moody’s, S&P and Fitch: one notch separates this balance sheet from high yield.
At-the-market equity issuance in each quarterly stockholders-equity note: resumption below tangible book would be dilutive rather than accretive.
Q3 2026 results, expected late October 2026, and the December 2026 dividend declaration.
$35.00: the low end of the sell range, where the sell question goes live.
$21.19: the Buy More Below price at which I’d move the sizing tier from Small to Standard.
Sources and diligence gaps. This analysis draws on VICI’s FY2025 Form 10-K, the Q2 2026 Form 10-Q, the 2026 definitive proxy statement, the Q4/FY2025 and Q2 2026 earnings releases, the August 2026 bond-offering and closing 8-Ks, the 2026 annual-meeting voting results, every Schedule 13G and Form 4 filed on VICI in 2025 and 2026, SEC XBRL company-concept data back to FY2019, Caesars’ own Q2 2026 earnings release, and the Q2 2026 earnings-call transcript. The 10-K and 10-Q were read in full; both are available from the SEC’s EDGAR system. The debt exhibit’s currency translations use the Bank of Canada’s historical currency converter and the Bank of England exchange-rate database.
Real gaps remain. The 2026 proxy’s Summary Compensation Table and audit-fee schedule were not reached in full, though the pay figures used above come from the proxy’s separately-disclosed pay-versus-performance table, which reports the same totals. The related-party section was reached only through its policy statement and negative disclosure, not a line-by-line schedule. The FY2023 and FY2024 annual reports were read for their financial statements but not their legal-proceedings items, so the litigation carry-forward in this report runs only from FY2025 forward. And the 8.25-year quarterly P/TBV history behind the sell range is a market-data series, not independently rebuilt point by point against filings; the current-period P/TBV used everywhere else in this report is derived directly from the balance-sheet bridge above, and it agrees with that series’ own latest observation within the tolerance this method requires. None of these gaps touches the balance sheet, the tangible-book bridge, the F-Score or the debt schedule, every figure in which came from primary filings and was cross-footed.
Research only, not investment advice. Position disclosure: Long, ~0.26% of portfolio.