

1. Scorecard
2. Argument
The short version
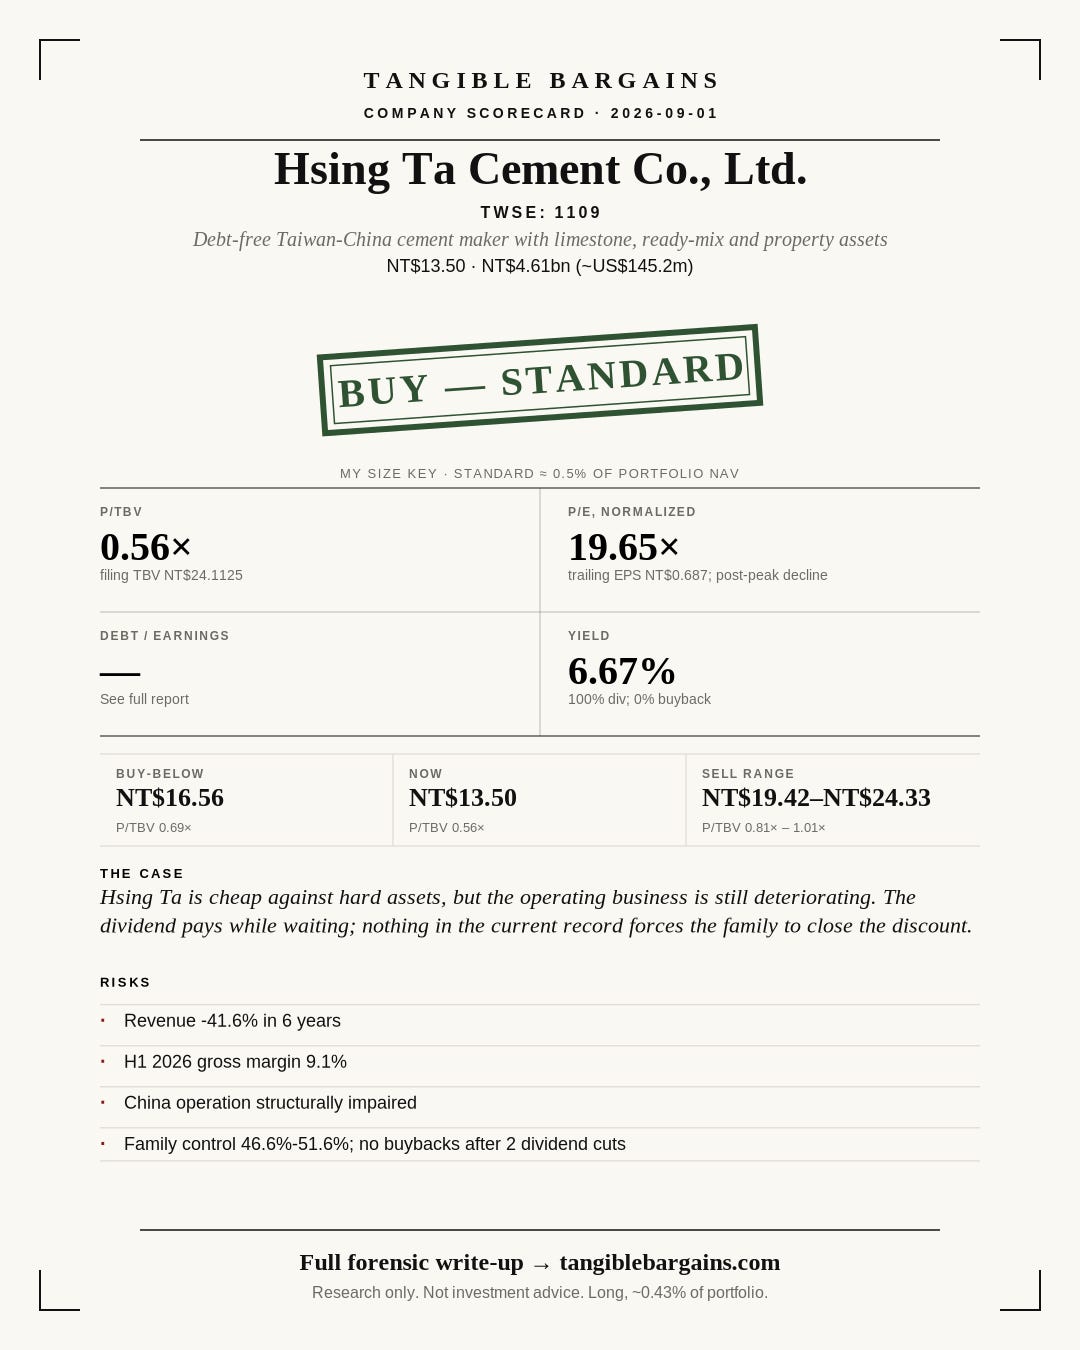
Hsing Ta Cement runs one cement plant in northeastern Taiwan and a second in Nanjing, China, plus a portfolio of Taiwanese land it has held for decades. At NT$13.50 the stock trades at 0.56 times tangible book value, and the company carries no bank debt of any kind. Cash and marketable securities alone are worth roughly what the stock costs, before counting two operating cement plants, a limestone quarry, a ready-mix subsidiary, and land the company says is worth roughly NT$5.37 billion more than it is carried on the books.
The reason it is this cheap is earnings, not the balance sheet. Revenue has fallen 41.6% over six years as Taiwanese demand has weakened and cheaper imported cement has taken share, and the Chinese plant is selling into a market that is still shrinking. The stock pays a 6.67% dividend while a buyer waits for the discount to close, but the family that controls the company has not bought back a single share at this valuation despite having the cash to do so.
Why it qualifies
Trades at 0.56x tangible book value, the cheapest point in a real ten-year quarterly trading history
No bank debt of any kind since February 2020; net financial assets alone are close to the full share price
Piotroski F-Score of 5 out of 9, with every solvency-related signal passing
6.67% dividend yield, covered more than once over by free cash flow
Disclosed investment property carried far below its stated fair value, an additional cushion beyond tangible book
Why it is not a clean bargain
Revenue down 41.6% over six years and still falling, down 17.0% for the first seven months of this year
Gross margin has compressed from 34.4% to 9.1% over the same stretch, with an operating loss in the first quarter
The founding family controls roughly half the shares, and the company funds a stake in an affiliated construction firm that in turn holds a board seat
The dividend has been cut twice in the past four years
No share buybacks despite the deep discount to book value, the clearest sign management is not planning to close the gap itself
The Chinese plant sells into a national cement market that is still contracting
What would change the view
Any board authorization of a share buyback
Monthly revenue returning to year-over-year growth (it was down 20.6% in July)
The outcome of a pending land exchange with the Taiwan government involving company-owned property
Third-quarter results, due around mid-November, and whether the second-quarter margin recovery holds
A ruling on the company's application for a reduced carbon-fee rate, worth roughly NT$150 million a year if granted
Sources and gaps
The half-year filing's footnotes on legal claims, commitments, and related-party dealings were not available at the time of this review; the most recent confirmation of those items comes from the prior quarter's filing. The disclosed value of the company's investment property is management's own estimate, not an audited figure.
3. Backup and sources
This last layer is the full working file: every source, calculation, and gap, kept so the argument above can be checked. The scorecard and the argument are the synthesis. Open this only if you want to check the work.
Hsing Ta Cement Co., Ltd.: Cheap against assets, weak at the operating line
1. Executive Summary
Hsing Ta Cement quarries limestone and burns clinker at an integrated plant at Su-ao in north-eastern Taiwan and at a second kiln complex at Nanjing in mainland China, sells Portland and blended cements, clinker and ready-mixed concrete into the two construction markets those plants can reach by truck and coastal barge, and collects rent and waste-processing fees on a portfolio of Taiwanese land and buildings alongside the kilns. Cement and clinker were 62.71% of FY2025 revenue and ready-mixed concrete a further 12.52%. The verdict is BUY at STANDARD sizing, and it is an asset verdict, not an earnings one: the size is held down by what the company is earning, not by what it owns. At NT$13.50 the shares change hands at 0.560x a tangible book value of NT$24.1125 per share, derived below from the 30 June 2026 balance sheet, against a business that carries no bank debt of any kind, holds NT$4.93 billion of cash and marketable financial assets against NT$1.32 billion of total liabilities, and discloses an investment-property portfolio worth roughly NT$5.37 billion more than the amount it is carried at.
The earnings side of the case is genuinely poor, and it is why the discount exists. Revenue has fallen from NT$7.59 billion in FY2020 to NT$4.43 billion in FY2025 and is running a further 17.0% below prior year for the seven months to July 2026. Gross margin has compressed from 34.4% to 16.0% across the same six years and to 9.1% in the first half of FY2026. The group reported an operating loss in the first quarter of 2026 and earned NT$0.15 of basic EPS in the first half against NT$0.49 a year earlier. Taiwanese housing-credit tightening has taken demand out of the domestic market at the same time as low-priced imported cement has taken share, and the Nanjing plant sells into a Chinese cement market whose national consumption is still contracting. This is a business earning well below its own history, not one temporarily off a peak.
What makes it investable anyway is the size of the asset cushion relative to the price. Net financial assets, cash, short-term investments and non-current financial assets less lease liabilities, after deducting the NT$307.0 million dividend paid on 16 July 2026, are roughly NT$13.37 per share against a NT$13.50 share price. A buyer pays about the value of the securities portfolio and receives two cement plants, a limestone reserve, the ready-mix subsidiary and the property portfolio for close to nothing. The Piotroski F-Score is 5 out of 9, failing four momentum-type signals and passing every solvency signal. The dividend of NT$0.90 per share is a 6.67% yield covered 1.14 times by FY2025 earnings and 1.72 times by FY2025 free cash flow. Right-of-use assets are only 2.1% of tangible book, so cheap against tangible book is a fair description here, not a lease artefact dressed up as one.
The risks that would break this are not financial-distress risks; there is no refinancing risk to speak of. They are governance and terminal-value risks. Two capital-allocation warnings fire, which sets Governance Risk: High: the Yang family controls roughly half the register while the company's own balance sheet funds a 19.90% stake in an entity that in turn wholly owns a board member, and the dividend has been cut twice in four years. Accounting quality is adequate. The auditor is PwC Taiwan, and the interim review conclusion carries a scope qualification covering subsidiaries that are 7.34% of consolidated assets.
2. Business and Market Overview


The group is a two-country cement producer with a property tail. The Taiwan business runs the Nansenghu plant at Su-ao, Yilan County, feeding it from limestone workings the company holds itself, and sold 583,000 tonnes of cement and clinker in FY2025 for NT$1,657,115 thousand, 5.9% less than in FY2024 on volumes 56,000 tonnes lower. Total Taiwanese cement consumption was 13.5 million tonnes in FY2025. The China business is Jiangsu Xinning New Building Materials at Nanjing, held through the 66.67%-owned Soaring Power Corporation, which sold 1,533,081 tonnes in FY2025 into a Nanjing regional market of roughly 8.5 million tonnes a year, where the company estimates its own share at about 18%. Taiwanese revenue fell 14.99% in FY2025 while the China plant grew 8.96%.
Alongside the kilns sit two smaller, structurally different revenue streams: resource-recycling and waste-processing income of NT$81,784 thousand in FY2025 and rental income of NT$48,599 thousand. In the first quarter of FY2026 the cement segment posted an external-revenue loss while the "other" segment, mostly recycling and rent, was the only part of the group that turned a profit that quarter.
Customer and supplier concentration is not disclosed in a form that supports a top-three figure. What is disclosed is a long list of single-year Chinese supply contracts for coal, slag powder, sandstone, gypsum, fly ash and refractories, none carrying restrictive covenants. Coal is the swing input, and management attributes the modest FY2025 profit recovery across the Chinese cement industry to lower first-half coal prices. Capital intensity is high in the accounting sense, NT$2.58 billion of owned property, plant and equipment, but low in the cash sense: capex has run between NT$128 million and NT$253 million a year for six years against depreciation and amortisation of NT$314 million in FY2025, so the plants are being maintained rather than expanded. As of 17 August 2026: July revenue was NT$292,047 thousand, down 20.6% year on year, with seven-month cumulative revenue down 17.0%. The business is understandable and cyclical. It is not predictable at the earnings line, and on the Chinese side it looks less like a cycle than a melting ice cube.
3. Moat, Competitive Position, and Industry Cycle
The traditional cement moat is efficient scale plus the freight cost of a low-value, high-weight product, and Hsing Ta has the raw materials of one: a permitted limestone reserve and an integrated kiln in a jurisdiction where nobody is going to permit a new cement plant, a second kiln with roughly 18% of the Nanjing regional market, and a downstream ready-mix subsidiary that captures part of its own output. None of the other four classic moat sources is present in any degree: no brand pricing power in bulk cement, no switching costs between two truckloads of Type I cement, no network effect, and no cost advantage. The company's stated strategy is to price at the market median, neither highest nor lowest, which is the language of a price-taker.
The freight moat is being arbitraged away by sea. Management says plainly that low-priced imported cement continues to erode the domestic market, that the industry association obtained anti-dumping duties on Vietnamese cement in July 2025 at rates up to 23.2%, and that it is now preparing an application against Indonesia. Reporting outside the filings indicates the Vietnamese duty has been substantially absorbed by falling Vietnamese prices, and that Taiwanese cement imports rose 13.77% in 2025 even as domestic production rose only 1.80%. The moat is best classified as Narrow and declining: real, but shrinking, and not enough to defend margin.
The margin history of the group is the evidence for the cycle. Gross margin ran 34.4% in FY2020, then 29.9%, 19.6%, 21.4%, 21.3% and 16.0% in FY2025, then 9.1% in the first half of FY2026. Volumes are falling in both markets, pricing is falling in China, and Taiwanese demand is being suppressed by deliberate credit policy. The right classification for the group is below mid-cycle, and for the Chinese operation specifically structurally impaired: national cement consumption there is forecast at about 1.85 billion tonnes for 2026, down a further 2.1%, and management's own case for the Nanjing plant is survival through compliance rather than growth. This company cannot compound capital at attractive rates on its operating assets; FY2025 return on equity of 4.6% against a six-year average of 10.4% says so. The investment case has to rest on assets and on the price paid, not on compounding.
4. Management, Governance, and Capital Allocation
The chairman is Yang Chih-hsiung, first elected a director in May 1991 and re-elected in June 2024 for a three-year term. The president is Yang Ta-kuan, in post since mid-2019. The board seated in June 2024 has nine members, three of them independent, the other six being five Yang family members and De Bo Investment Co., represented by Yang Po-wei. All three independent directors attended every board meeting in FY2025, and an audit committee has voted on every set of financial statements since 2022.
Insider activity was mildly positive. In FY2025 the president increased his holding by 110,000 shares to 9,025,431 (2.65% of the company); the chairman added 30,000 shares in early 2026; no other director or officer bought or sold. A 6,500,000-share pledge against one director was released during FY2025, and there is no outstanding share pledge as of the report date, a mild positive. There is no share-based compensation at all: no employee share bonus, no options, no restricted shares, nothing dilutive outstanding.
Related-party dealing is small. Two related entities are named in the most recent quarterly note, together accounting for a few million New Taiwan dollars of freight and leasing services a quarter, all on stated normal commercial terms. The only endorsements or guarantees outstanding run inside the group, between the parent and its ready-mix subsidiary, both within board-set limits.
Capital allocation over six years has been conservative to a fault: no acquisitions, no share issuance, no borrowings, capex held to maintenance levels, and NT$2,391 million returned in dividends between FY2020 and FY2025. There have been no share repurchases in FY2024 or FY2025, and that is the real criticism here. A company trading at 0.56x tangible book with NT$4.9 billion of financial assets and no debt has not bought back a single share, while it has continued to fund a 19.90% stake in an affiliated construction company. Dividends per share ran NT$1.10, NT$1.50, NT$1.50, NT$0.80, NT$1.20 and NT$0.90 for the years paid FY2020 through FY2025.
Two capital-allocation warnings fire here, and both are worth stating plainly rather than just counting. The first is control without minority protection: seven of the top ten holders are declared related within the second degree of kinship and hold 46.57% of the company; including two further family members the bloc is 51.62%. The board itself was elected by genuine shareholder vote on a real three-year cycle, with two new independent directors added in 2024, which cuts the other way. But the company itself holds 19.90% of Chin Ta Construction, which in turn wholly owns De Bo Investment, the corporate entity that occupies a board seat: shareholder capital is funding a member of the controlling bloc's own board representation, which is the opposite of minority protection. The second is a dividend cut within the past several years: the payout fell from NT$1.50 to NT$0.80 for FY2022 and again from NT$1.20 to NT$0.90 for FY2024. Two more possible flags do not fire. Related-party purchases run about NT$14 million a year against NT$4.4 billion of revenue, immaterial and stated at market terms, and director pay sits inside the company's own articles-based cap. A fifth, whether management has ever ducked a shareholder question, cannot be assessed: nine investor conferences have been held since 2017 but no transcript was reachable. Two warnings fired is what sets Governance Risk: High.
5. Corporate Ownership, Subsidiaries, and Joint Ventures
The register is concentrated in one extended family. The ten largest shareholders disclosed as of April 2026 were Yang Jen-hsiung (10.58%), Yang Chung-hsiung (10.27%), chairman Yang Chih-hsiung (10.25%), Hu Mei-hung (6.06%), Hyde Bo Capital (4.51%), Kao Yang Hsueh-ching (3.51%), Yang Chen Shu-o (3.10%), Lin Hsueh-hua (2.79%), president Yang Ta-kuan (2.65%) and Yang Ta-ching (2.40%). Together they held 56.13% of the company.
The register is therefore controlled in practice, not merely concentrated on paper.
Seven of those ten are declared related within the second degree of kinship, holding 46.57% between them. There is a single class of ordinary shares, 341,158,868 outstanding, no treasury shares, one vote each; free float is therefore about 44%. Trading volume in the first two September 2026 sessions was 52,000 and 76,000 shares, a genuinely illiquid microcap by value traded.
The group's structure and cross-holdings, as of March 2026: Hsin Yi Ready-Mixed Concrete (55.20% direct, 93.67% combined with insiders) is the Taiwan ready-mix arm and is consolidated. Hsin Ni Development (98.00%) is a Taiwan development vehicle, also consolidated. Soaring Power Corporation (66.67%) is the offshore holding company for the China operation. Chin Ta Construction (19.90% direct, 23.57% combined) is an associate that wholly owns De Bo Investment, which holds a board seat. Beneath Soaring Power sit the Nanjing kiln itself, Nanjing Xinrong and Xinning Trading. Non-controlling interests carry NT$1,934,735 thousand of the group's NT$10,178,824 thousand of equity at 30 June 2026, the large majority of that being the 33.33% of the China operation the company does not own, which matters because consolidated cash is not all attributable to Taipei shareholders. As of 22 April 2026: the subsidiary Nanjing Xinrong obtained its tax-clearance certificate, the standard precursor to deregistering a Chinese entity.
6. Historical Financial Quality and Normalized Owner Earnings
The six-year consolidated record is shown in the financial-quality exhibit below. It keeps the useful comparisons together without making the reader fight a wide text table.
The shape is unambiguous: revenue down 41.6% in six years, gross margin down 18.4 points and net income down 74%, while tangible book per share still rose 12.5% because the group retains more than it pays and has no debt to erode. The current year is worse than any of these. First-half FY2026 revenue was NT$1,857,847 thousand against NT$2,251,696 thousand, gross margin 9.1% against a prior-year 16.2%, and profit attributable to owners NT$50,378 thousand against NT$167,121 thousand, basic EPS of NT$0.15 against NT$0.49. The first quarter of 2026 was the trough, an operating loss on a 6.2% gross margin; the second quarter recovered to roughly an 11.6% margin. July revenue, down 20.6% year on year, says the recovery is not yet visible in the top line.
FY2025 owner earnings, net income plus depreciation and amortisation less maintenance capex, were NT$451,253 thousand, and because capex has run below depreciation in five of the last six years, essentially all of it is maintenance rather than growth spending. Free cash flow was NT$528,314 thousand in FY2025, comfortably covering the dividend; on a trailing twelve-month basis it is NT$282,054 thousand, still covering the dividend but only once the roughly NT$245 million spent on investment property in the first half is set against it, at which point the group is running a modest cash deficit before dividends.
The trajectory here is a post-peak decline: FY2020 was the earnings peak and every year since is lower, with the trailing figure the lowest of all. The normalized EPS this report uses is therefore the trailing twelve-month figure, NT$0.687 per share, rather than a multi-year average that would flatter the stock. Cumulative free cash flow over the six years was NT$5,494 million against cumulative net income of NT$4,894 million, a 112% conversion, but working capital has turned into a headwind: inventories rose in the first quarter of 2026 even as volumes fell.
6.5 Piotroski F-Score: 5 out of 9
Comparing FY2025 to FY2024, the score passes on positive net income, positive operating cash flow, earnings quality (operating cash flow exceeds net income by a wide margin), unchanged leverage (zero debt in both years) and no dilutive share issuance. It fails on return on assets (3.4% against 4.5%), the current ratio (5.80 against 7.00, still extraordinary in absolute terms but lower than the year before), gross margin (16.0% against 21.3%) and asset turnover (0.393 against 0.403).
All four failures are the same failure seen four ways: the business is shrinking. None of the four is a solvency signal. Every signal that speaks to solvency and to shareholder treatment passes cleanly, and the accruals signal passes by a wide margin, with operating cash flow at roughly twice net income. A score of 5 out of 9 sits squarely in the eligible band and, on its own, neither supports nor obstructs the verdict.
7. Balance Sheet, Debt, Covenants, and Refinancing Risk
There is nothing to refinance. The consolidated balance sheet at 30 June 2026 shows no short-term borrowings, no long-term borrowings, no bonds and no commercial paper, and no such line has appeared in any period since FY2020; the annual report states directly that the company's US-dollar bank loans were repaid in full in February 2020 and that it currently has no bank loans of any kind. The only interest-bearing obligations are lease liabilities of NT$57,027 thousand, 0.7% of the NT$8,244,089 thousand of equity attributable to owners. On the most punitive reading, every liability of every kind against total equity, the ratio is 12.96%. Total liabilities are 11.5% of total assets. First-quarter finance costs were NT$420 thousand, entirely lease unwind, against NT$9,479 thousand of interest income, so the group is a net receiver of interest. The classification is Net Cash, and it is not a marginal call.
The maturity wall consists of lease payments and nothing else, and there are no covenants because there is no credit agreement. As of 16 July 2026: the FY2025 dividend of NT$307,043 thousand was paid, having been accrued at 30 June and already deducted from the equity and tangible book value used throughout this report, but since left the cash balance. Adjusting for it, net financial assets less lease liabilities are approximately NT$4,562,655 thousand, or NT$13.37 per share against a NT$13.50 share price. Two caveats belong with that figure: about a third of the Chinese subsidiary's net assets belong to non-controlling interests, so not all consolidated cash is attributable to Taipei shareholders, and a material part of the cash sits in mainland China, where distribution to the parent requires the usual approvals and withholding.
8. Real Estate, Leases, and Hidden Assets
Right-of-use assets are NT$170,515 thousand at 30 June 2026, 2.1% of tangible book value, against lease liabilities of NT$57,027 thousand. The gap between the two suggests most of the balance is long-prepaid land-use rights at the Chinese plant rather than ordinary operating leases. The real downside support is elsewhere: NT$4,926,725 thousand of cash and financial assets, NT$897,564 thousand of inventory, and NT$2,583,577 thousand of owned plant.
The hidden asset is the property, and it is large. The company's investment-property note discloses a fair value of NT$7,029,841 thousand at 31 March 2026 against a carrying amount of NT$1,654,986 thousand, an unrecognised surplus of NT$5,374,855 thousand, or NT$15.75 per share before any tax, on a stock trading at NT$13.50. That is management's own estimate rather than an audited figure, derived from independent appraisal or internal assessment. Two constraints belong with it. Taiwanese land disposals attract land value increment tax, so the realisable surplus is materially below the gross figure; at a 40% combined tax and cost haircut the uplift is roughly NT$9.45 per share. And the yield on the portfolio is poor while it is held, about 1.9% on carrying value and roughly 0.4% on the disclosed fair value, which is what land held for development rather than income looks like.
Three parcels drive it. The Guanxi land, carried at NT$673,413 thousand, is the subject of a decades-old community development plan; some of the farmland portions are still registered to natural persons under trust agreements pending reclassification, and the company holds mortgages over those parcels to protect its position, a real, disclosed title risk. As of 28 October 2025: a state land exchange for this parcel was approved by the National Property Administration's valuation committee; replacement land was bought and registered by February 2026, and the exchange is now with the Ministry of Finance for final review. Separately, under a 2020 joint-construction contract, the company is contributing land in Taipei's Zhongzheng District to a project where a construction partner funds the build and the two share the completed units; the building permit was obtained in 2024 and construction started in January 2025. None of this is in earnings, and none of it is in tangible book above cost.
9. Capital Markets Access, Dilution, and Financing Flexibility
The share count has gone one way, down: from 359,955,650 in 2017 through two capital reductions and a treasury-share cancellation to the present 341,158,868, unchanged since 2023. There has been no equity issuance of any kind, and nothing outstanding, options, convertibles or otherwise, could dilute the current count.
The company does not rely on capital markets to fund itself and has not since its bank loans were repaid in 2020: operations generated NT$5,494 million of cumulative free cash flow over six years, and it holds NT$4.93 billion of cash and financial assets as its own liquidity backstop. Dilution risk is therefore assessed as none. The mirror image of that strength is the missing action: with no debt, surplus liquidity and the stock at 0.56 times tangible book, the repurchase authority has been left unused, a capital-allocation criticism rather than a financing risk.
10. Litigation, Regulatory, and Contingent Liability Risk
The company's own disclosure records no contingencies, no casualty losses, and no material litigation or administrative proceedings involving the company, its directors or any subsidiary. What is disclosed instead is a set of small regulatory penalties and one large regulatory swing factor. In FY2025 the Taiwan labour authority fined the company three times under the Occupational Safety and Health Act, for an unguarded welding terminal, a dropped refractory brick that injured a worker, and a worker struck by an overhead crane during unsupervised maintenance. The fines total NT$410,000 and are immaterial in money, but three penalties in four months, two involving injuries, are a real signal about site discipline at an ageing plant.
The large item is carbon pricing. The company is in the first cohort of Taiwanese carbon-fee payers and estimates that at the general rate the annual charge would be about NT$170 million, roughly a third of FY2025 pre-tax income. A voluntary reduction plan was approved in December 2025, qualifying it for a preferential rate, and the company applied in January 2026 for high-carbon-leakage-risk status, which management says would cut the effective cost to about NT$20 per tonne. The gap between the general rate and the qualified rate is on the order of NT$150 million a year, and qualification is annual and conditional on hitting production targets for low-carbon cement. That is the single largest contingent item in this analysis. One gap should be stated plainly: the half-year contingencies and subsequent-events notes at 30 June 2026 were not reached in this review, so the most recent note-level confirmation of "no contingencies" is from 31 March 2026.
11. Accounting Quality and Disclosure Review
The auditor is PricewaterhouseCoopers Taiwan. Partner rotation took effect in late 2025, for mandatory-rotation reasons combined with an internal reorganisation at the firm; the company records no disagreement with its auditor and no audit opinion other than unqualified in the last two years. Non-audit fees are a small fraction of audit fees and almost entirely compliance work.
One qualification does need stating. The review conclusion on the Q1 FY2026 consolidated statements is qualified: the statements of non-significant subsidiaries in the consolidation, together about 7% of consolidated assets, were not reviewed. This is a common and comparatively benign Taiwanese interim scope limitation, and the annual statements are audited without qualification, but it means roughly 7% of the asset base behind the tangible-book bridge is unreviewed at the interim dates.
The accounting itself is plain. There is no goodwill, and other intangibles are 0.2% of tangible book, so intangible impairment cannot materially damage book value. Related-party disclosure is specific and complete. Two weaknesses temper the assessment: the group reports as a single segment even though the Taiwanese and Chinese cement operations have materially different economics, and the largest single estimate in the accounts, the investment-property fair value, is management's own Level 2/3 assessment supporting assets carried at cost, and it is the number this thesis most depends on. Disclosure quality is classified as Adequate.
12. Valuation and Margin of Safety
Tangible book value, anchored to the 30 June 2026 balance sheet: common shareholders' equity of NT$8,244,089 thousand, less no goodwill and less NT$17,902 thousand of other intangibles, gives tangible book of NT$8,226,187 thousand. Divided by the 341,158,868 shares outstanding, that is NT$24.1125 per share. At NT$13.50, P/TBV is 0.560x. The equity figure is already net of the NT$307,043 thousand FY2025 dividend paid in July, so tangible book per share here is a post-dividend figure.


The book-value leg of the valuation rests on a ten-year, 40-observation quarterly price-to-tangible-book history for the shares. Today's 0.560x sits below the entire ten-year series, at the 0th percentile, cheaper than any of the forty observations and 9.7% below the lowest of them. That is the central quantitative fact of this report. No sourced multi-year earnings multiple was available for this issuer, so the earnings leg of valuation is carried separately in the scenario table below rather than blended into one number; the trailing normalized P/E of 19.65x is a reminder that the cheapness here is entirely a balance-sheet phenomenon, not an earnings one.
Sell Range: NT$19.42 to NT$24.33 (0.81x to 1.01x TBV), built from the median and top-quartile mean of the stock's own ten-year P/TBV history applied to current tangible book. That band was earned across a decade in which return on equity averaged 10.4%; trailing return on equity today is 2.84%, roughly 73% below that average. Absent either an earnings recovery or a monetisation of the property surplus, the realistic exit zone is the lower half of the range, roughly NT$19.4 to NT$21.5, and only a completed Guanxi land exchange or delivered Taipei units would make the top of the range credible.
Buy-Below: NT$16.56 (0.69x TBV), the mean of every observation at or below the stock's own 25th-percentile P/TBV over the same ten-year window. The stock is currently 18.5% below it.
Asset-heavy cement is normally also checked on enterprise value: taking market capitalisation plus minority interests at book plus lease liabilities less cash and financial assets, the group trades at roughly 3.5x trailing EV/EBITDA even after crediting minorities in full at book. Excluding minorities the enterprise value is close to nil, the same fact from a different angle.
The scenario lens is deliberately separate from the mechanical own-history range:
Severe downside: Taiwan volumes fall a further 20%, the Nanjing kiln runs at a cash loss and is impaired; the market pays for the securities portfolio and nothing else, or NT$9.65 per share.
Bear case: trailing earnings persist, the dividend is cut to NT$0.60 and no property event occurs, or NT$12.06 per share.
Base case: earnings stabilise around NT$1.00 to NT$1.20 of EPS and the NT$0.90 dividend is held, or NT$19.42 per share.
Bull case: volumes recover and the valuation returns to its own top quartile, or NT$24.33 per share.
Asset realisation lens: the Guanxi exchange completes, Taipei units are delivered and the property surplus is realised after a 40% land-tax and cost charge, or NT$33.57 per share.
Margin of safety at NT$13.50: 44.0% below tangible book value, and 30.5% below the bottom of the intrinsic value range. This is asset-value cheap, with a live value-trap risk attached. It is not a compounder at a discount, and it is not a clean cyclical-recovery case either, because the Chinese half of the asset base faces structural rather than cyclical decline. It is a balance sheet, securities, land and two paid-for kilns, available at a 44% discount to its own tangible book, where the operating business is currently earning almost nothing and the catalyst for revaluation is neither dated nor promised.
13. Risk Matrix
The main risks are easier to read as a list than as a wide matrix:
Chinese cement: national consumption is forecast down a further 2.1% in 2026, with prior intangible impairment and mandated emissions spending.
Taiwan imports: domestic revenue fell 14.99% in FY2025 while imports rose 13.77% and production rose 1.80%.
Value trap: the shares are at the bottom of their ten-year P/TBV history, but management has not repurchased stock.
Governance: the family bloc controls 46.57% to 51.62%, reinforced by the company's 19.90% stake in an affiliate whose subsidiary holds a board seat.
Carbon fees, Guanxi title and exchange execution, and the management-estimated property fair value remain live swing factors.
14. Red Flags, Yellow Flags, and Green Flags
Green Flags
Zero financial borrowings since February 2020; total liabilities are 11.5% of total assets.
NT$4,926,725 thousand of cash and financial assets against a NT$4,605.6 million market capitalisation, about NT$13.37 per share net of leases and the dividend paid in July 2026.
Disclosed investment-property fair value up from NT$6,370,199 thousand a year earlier to NT$7,029,841 thousand.
Share count down from 359,955,650 in 2017 to 341,158,868 today, with nothing outstanding that can dilute.
A dividend in every year examined, NT$2,391 million cumulative FY2020 to FY2025, yielding 6.67% and covered 1.72 times by FY2025 free cash flow.
Yellow Flags
Gross margin down from 34.4% in FY2020 to 16.0% in FY2025 and 9.1% in the first half of FY2026, with an operating loss in the first quarter.
July 2026 revenue down 20.6% year on year and seven-month revenue down 17.0%; the top line has not turned.
Trailing return on equity of 2.84% against a six-year average of 10.4%, why the top of the sell range is not currently credible.
Three occupational-safety penalties inside four months of FY2025, two after injuries.
A qualified interim review conclusion, and one reportable segment for two economically different geographies.
Inventories up even as volumes fell, and receivables at around 90 days of sales.
Red Flags
Family control of 46.57% to 51.62% reinforced by a company-funded 19.90% reciprocal stake in an affiliate whose subsidiary holds a board seat.
The dividend was cut from NT$1.20 to NT$0.90 for FY2024, after NT$1.50 to NT$0.80 for FY2022.
No share repurchase in FY2024 or FY2025 while the stock traded at an all-time-low valuation on its own ten-year record, with no debt and NT$4.93 billion of financial assets.
The Chinese operation, roughly a third of the asset base, faces structural rather than cyclical decline and has already required an intangible impairment and heavy mandated compliance capex.
The Case in Brief
At NT$13.50, this stock trades at 0.560x tangible book value, the cheapest point in a real ten-year quarterly history, against a company that carries no bank debt of any kind and holds cash and financial assets close in value to the entire market capitalisation. The Piotroski F-Score is 5 out of 9, with every solvency signal passing. The dividend yields 6.67%. None of that is in dispute; the discount is real.
What is also real is that the company is earning very little right now, revenue down 41.6% over six years and still falling, and that the family that controls just over half the shares has not bought back a single share of stock at this valuation, while continuing to fund a stake in an affiliated construction company that reinforces its own board seat. That combination, real cheapness alongside a controlling family showing no urgency to close the gap, is why this is sized Standard rather than Big, and why the position calls for patience rather than conviction that a catalyst is coming. The dividend pays while a buyer waits. Nothing currently forces the re-rating the upper half of the valuation range depends on.
Value Investor Watch List
Any board authorization of a share buyback, the clearest test of whether the controlling family will act on the discount.
Monthly revenue returning to year-over-year growth; it was down 20.6% in July 2026.
The Ministry of Finance's decision on the pending Guanxi land exchange with the Taiwan government.
Delivery of the Taipei Zhongzheng joint-construction project, permitted in 2024 and started in January 2025.
Third-quarter results, due around mid-November 2026, and whether the second-quarter margin recovery held.
The Ministry of Environment's ruling on the company's high-carbon-leakage-risk application, worth roughly NT$150 million a year if granted.
Each quarterly investment-property fair-value disclosure, which has grown at each of the last three dates reported.
Any Indonesian anti-dumping determination, following the Vietnamese cement duties imposed in July 2025.
The FY2026 dividend declaration, expected around March 2027, against an FY2025 payout that already absorbed 87% of earnings.
Research only, not investment advice. Position disclosure: Long, ~0.43% of portfolio