

1. Scorecard
2. Argument
The short version
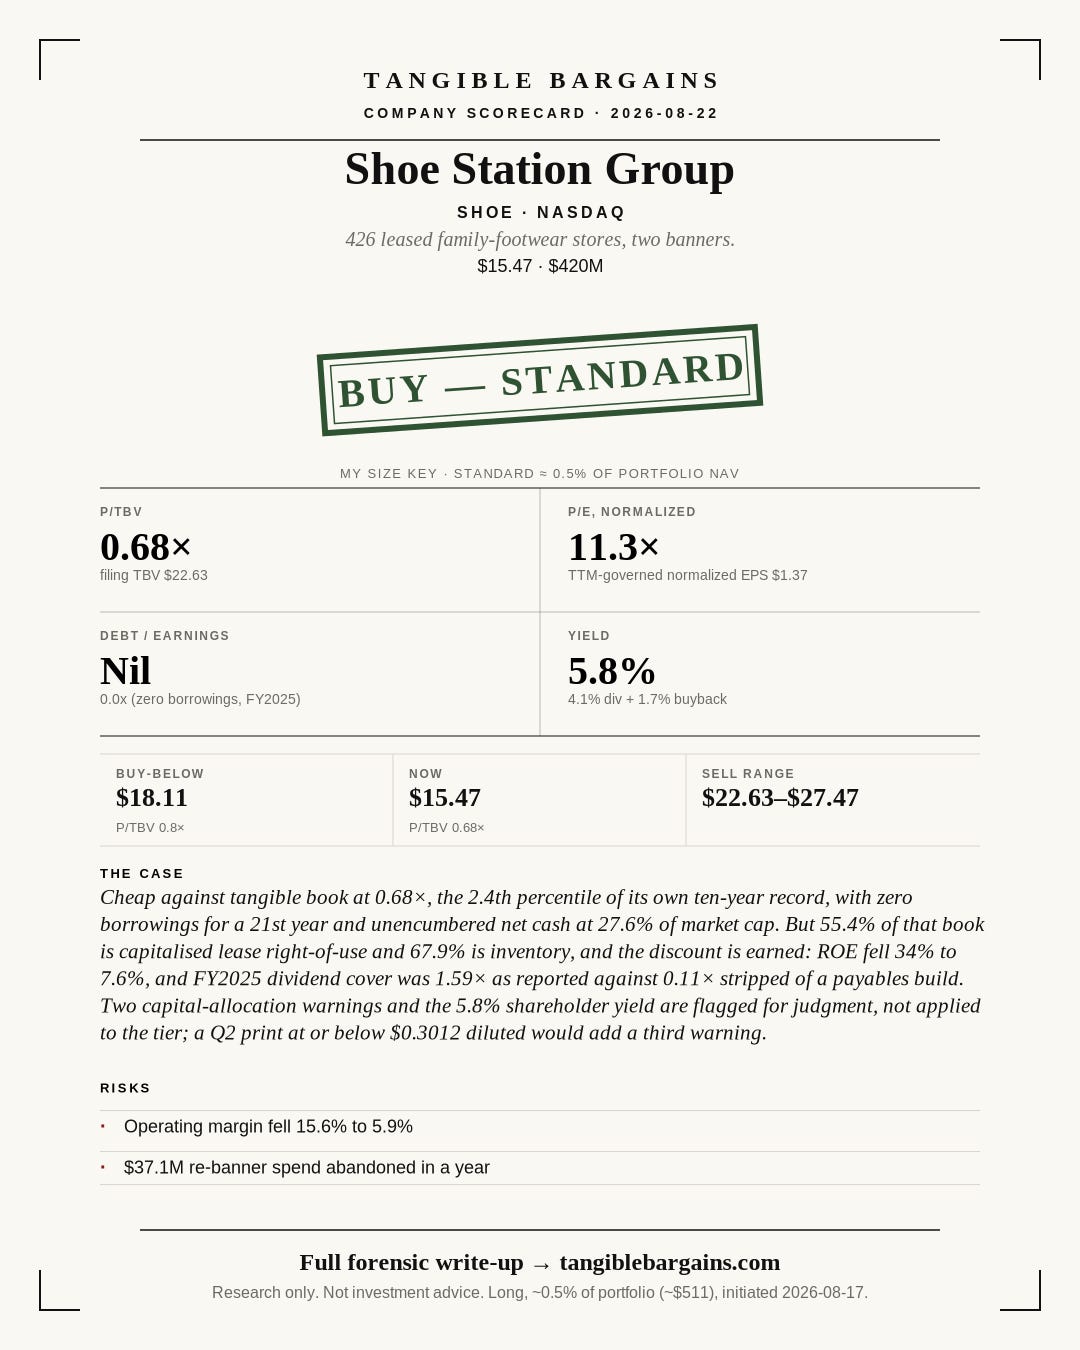
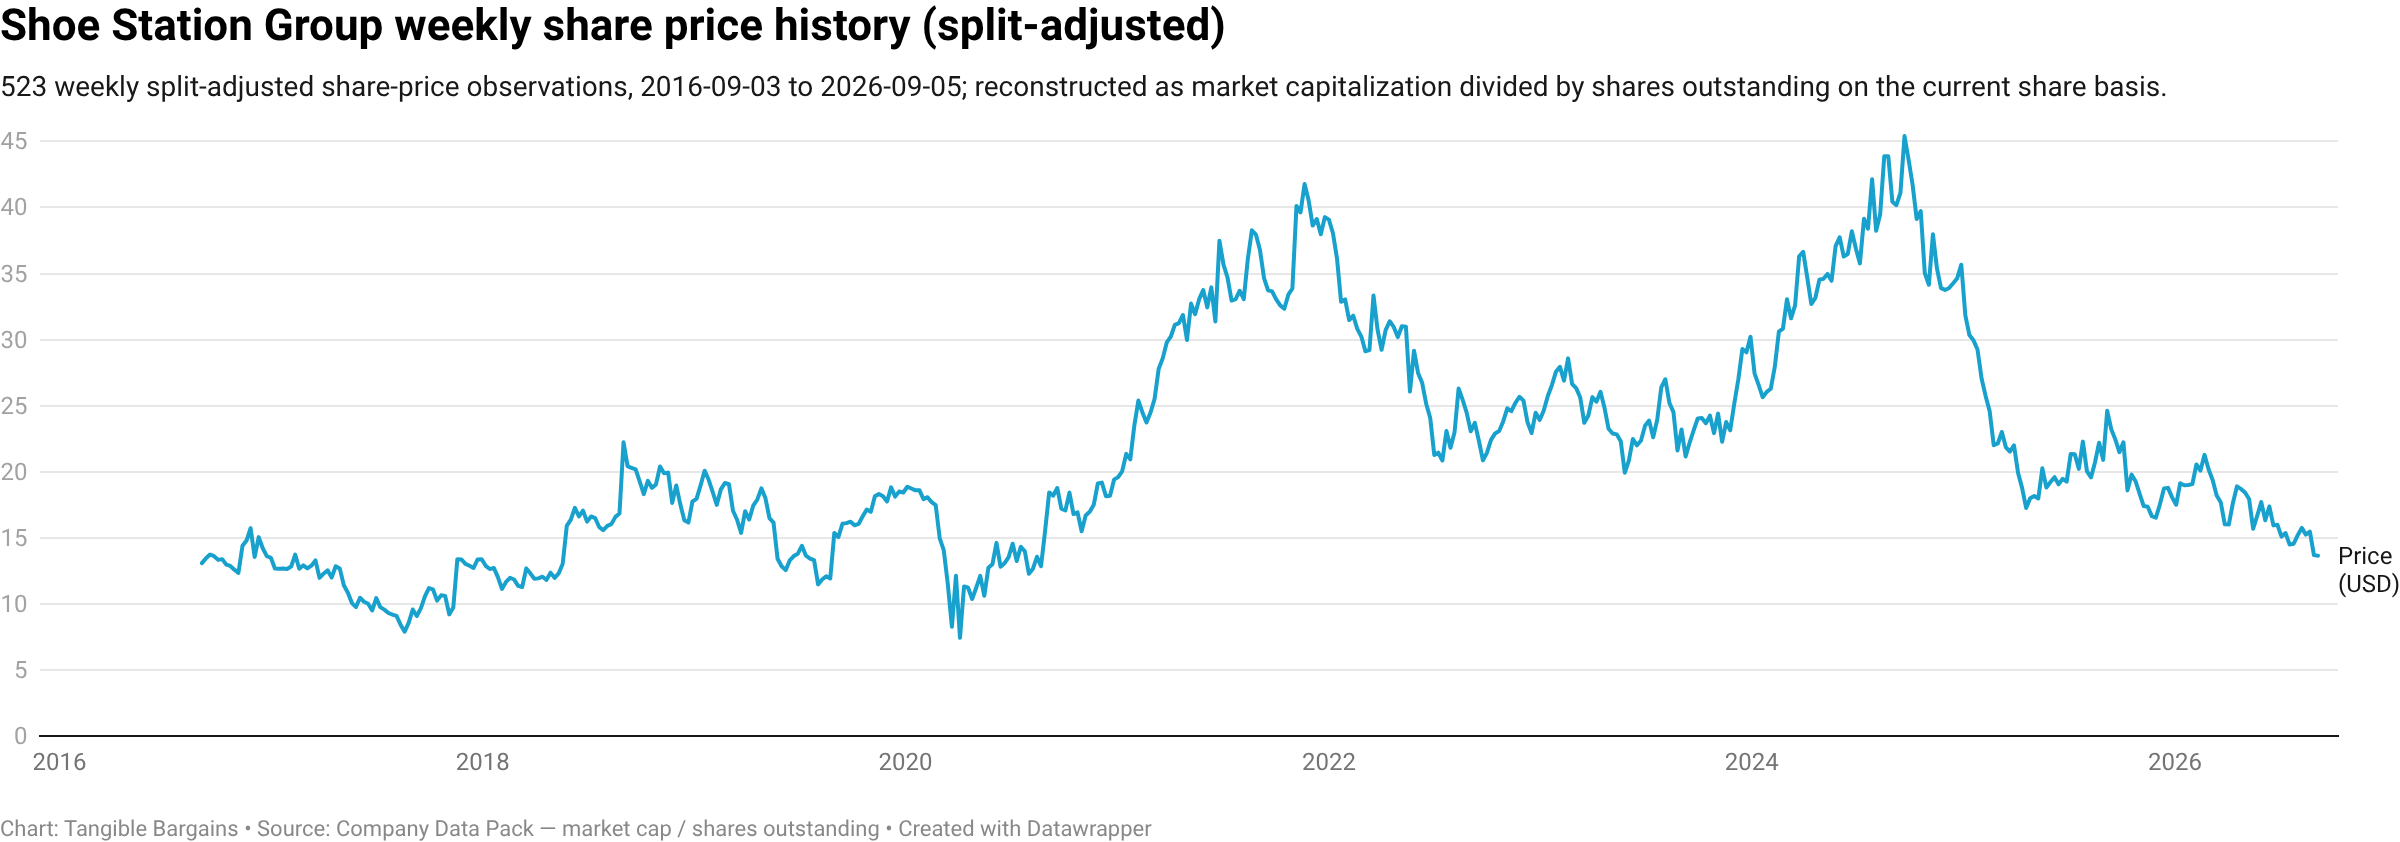
Shoe Station Group is a 426-store family-footwear retailer trading at 0.68x filing-derived tangible book. At $15.47, the shares sit near the bottom of their own historical valuation range. The balance sheet gives the thesis room: the company has zero financial borrowings, about $116.1 million of unencumbered cash, and no refinancing wall.
The problem is that the operating business has deteriorated. Return on equity fell to 7.6% in FY2025, operating margin fell from 15.6% in FY2021 to 5.9%, and inventory became harder to clear. Management spent roughly $37.1 million converting 101 stores to the Shoe Station banner, then abandoned the program and recorded $8.3 million of impairments.
That makes this a real bargain with a real problem attached. The balance sheet can buy time. It cannot restore the old economics by itself, and tangible book is not a liquidation floor when leases and inventory make up so much of the anchor.
Why it qualifies
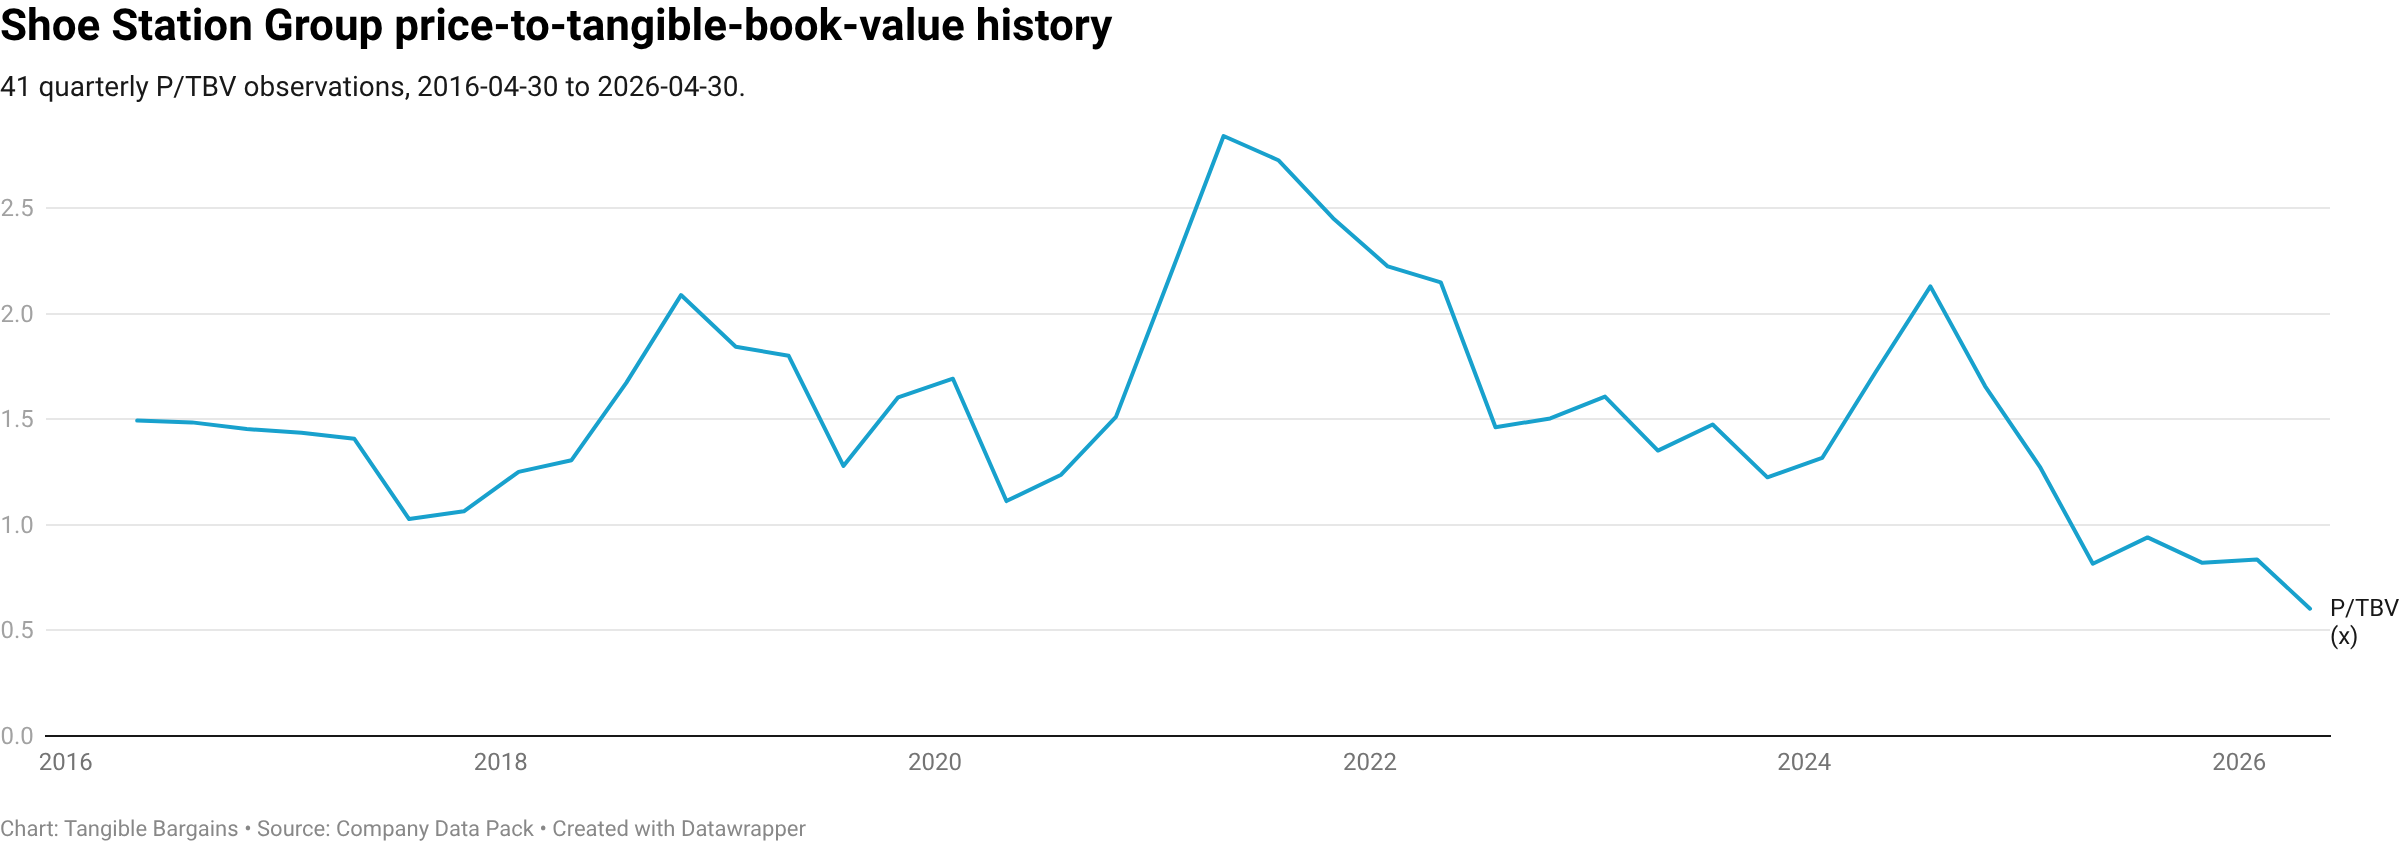
The shares trade at a discount to filing-derived tangible book and at the 2.4th percentile of the company's own ten-year P/TBV history.
The company has zero financial borrowings for a 21st consecutive year, so lender pressure and a maturity wall are not the immediate risks.
The F-Score is 5/9 and remains eligible under the survival rules. A 5.8% shareholder yield and two capital-allocation warnings are flagged for judgment, not applied to the tier.
The core downside question is understandable: can a debt-free retailer clear inventory and stabilize returns before the tangible-book discount stops mattering?
Why it is not a clean bargain
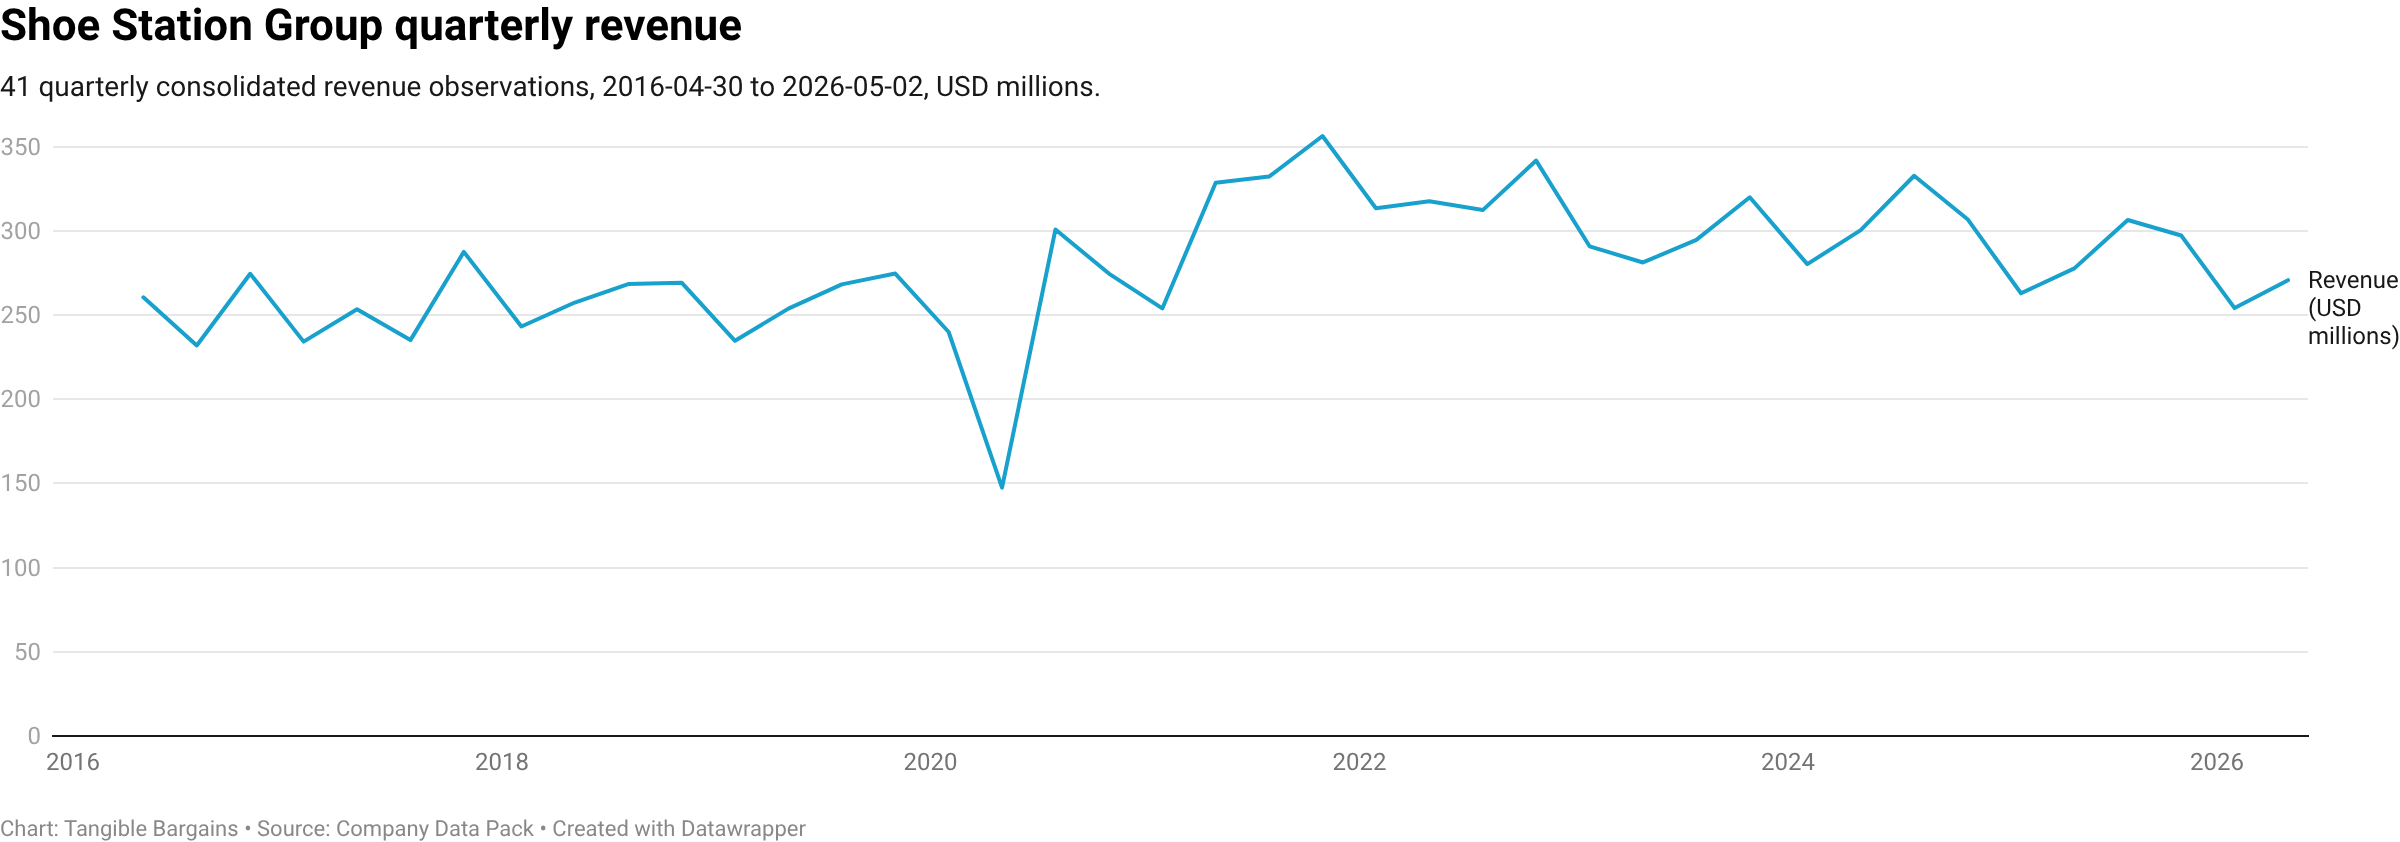
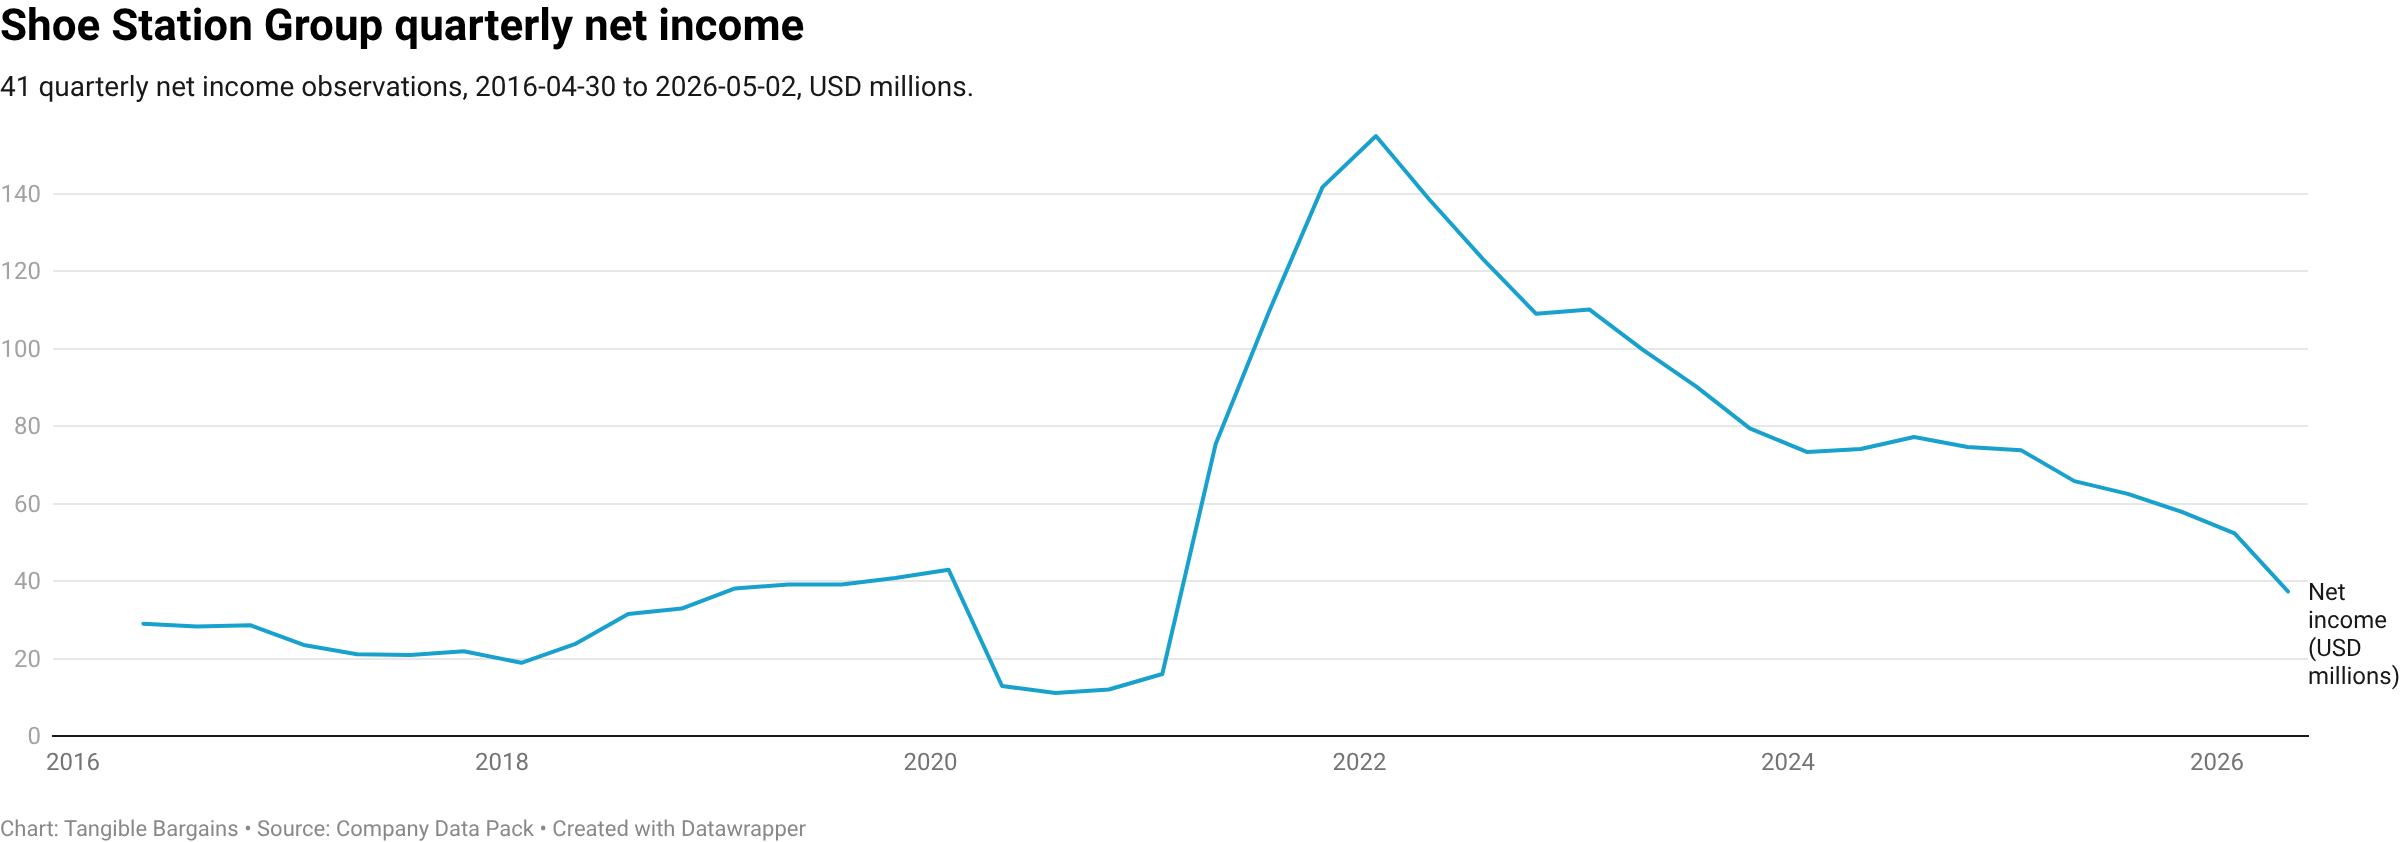
The operating record is moving the wrong way. Revenue fell 5.6% in FY2025, operating margin fell to 5.9%, and the first quarter of FY2026 was a loss.
Inventory days rose from 181.8 to 222.8 while cost of goods sold fell, and a reported dividend-cover figure of 1.59x falls to 0.11x after stripping out a payables build.
The re-banner program is a capital-allocation failure: 101 conversions, roughly $37.1 million spent, $24.1 million of operating-income drag, and $8.3 million of impairments before the program was abandoned.
Governance risk is High with two warnings: concentrated family control and capital routed into the failed re-banner project. The interim CEO adds uncertainty about the next capital-allocation regime, but a credible permanent CEO with better capital allocation would be a positive catalyst.
The tangible-book anchor needs qualification. Right-of-use assets are 55.4% of tangible book and inventory is 67.9%, so this is cheap against tangible book, not an asset-backed liquidation play.
How a minority holder gets paid
For a minority holder, the payoff is likely to come from ordinary cash returns and mean reversion, not a control event. The company has raised its dividend for twelve years and has resumed buybacks while it remains below tangible book. If inventory and margins stabilize, the market can re-rate the shares toward the report's sell range without a sale of the company. If they do not, the cash balance and ongoing dividend provide time but not a floor. The holding therefore depends on a cleanup in operating returns, not on family control changing hands.
What would change the view
Q2 diluted EPS and gross margin, especially a diluted result at or below roughly $0.3012.
Inventory clearance at price rather than through markdowns, together with the direction of inventory days and the auditor's inventory realizable-value judgment.
A reversal of the payables build that shows whether reported cash generation can support the dividend without working-capital help.
A credible permanent CEO appointment followed by evidence of better capital allocation would reduce the governance discount, especially if the company does not repeat the abandoned conversion strategy.
A dividend cut, further store impairments, a material inventory write-down, or renewed margin erosion.
Sources and gaps
The full report reviews the latest annual and quarterly filings, ownership and insider material, the historical P/TBV series, and the relevant accounting and governance disclosures. The next quarterly filing is not yet available. There is also no earnings-call transcript in the reviewed record, so management's answers on capital allocation remain unassessable rather than treated as a pass.
3. Backup and sources
This last layer is the full working file: every source, calculation, and gap, kept so the argument above can be checked. The scorecard and the argument are the synthesis. Open this only if you want to check the work.
The short layers use the 22 August market snapshot. The detailed report preserves the 17 August closing-price inputs used in its original valuation math; every price reference below is dated.
Company snapshot
Company: Shoe Station Group, Inc. (formerly Shoe Carnival, Inc. through 2026-06-11)
Ticker: SHOE (NASDAQ) — traded as SCVL until 2026-06-11
As of: 19 August 2026
Current price: $15.50 (~$417M market cap)
Verdict: BUY — STANDARD
Buy-below: $18.11 (0.80× TBV)
Buy More Below: $14.71 (0.65× TBV)
Sell range: $33–$50 (1.48×–2.20× TBV)
Moat: Weak
Governance risk: High (2 warnings)
Primary sources reviewed
Annual report: Form 10-K, FY2025 (ended 2026-01-31), filed 2026-03-26 — acc. 0001193125-26-126279
Latest quarterly: Form 10-Q, Q1 FY2026 (ended 2026-05-02), filed 2026-06-05 — acc. 0001193125-26-258362
Proxy: DEF 14A, filed 2026-04-29 — acc. 0001193125-26-191497
Earnings release: Form 8-K Ex-99.1, filed 2026-03-26 — acc. 0001193125-26-125001
Insider activity: All 24 Forms 4 filed 2025-08-16 → 2026-08-16, XML parsed
Historical filings: 10-Ks for FY2024, FY2023, FY2021, FY2019 (EPS and balance-sheet history)
Financials and charts: Exported 2026-08-17; includes 41 P/TBV observations
Data quality: EXCELLENT
Full detail: Shoe Station Group
1. Executive Summary
Shoe Station Group is a 426-store omnichannel footwear retailer, operating the value-focused Shoe Carnival banner and the higher-income Shoe Station banner across 35 states and Puerto Rico. It trades at 0.685× tangible book value (2026-08-17 close, $15.50) — a hair above the ten-year window floor of 0.673× recorded in April 2026, and still far below anything the stock has traded at outside the last eight months — with zero borrowed money, $129.3M of net cash equal to 31% of the share price, and a 4.44% dividend raised for the twelfth consecutive year. The verdict is BUY — STANDARD.
Two capital-allocation problems keep this from screening as an unambiguous top-tier holding despite the balance sheet. In the twelve months to August 2026 the company converted 101 stores to its Shoe Station banner at a cost of roughly $0.66 per share of earnings and a 35% increase in capex, then wrote the program down and abandoned it, taking $8.3M of impairments and announcing 18–24 store closures. It terminated the CEO who authored that strategy, paid him $4.8M in severance plus accelerated stock, and six months later still has no permanent replacement. That is not a balance-sheet problem; it is a capital-stewardship problem, and Schloss-style investing tolerates cheap assets far better than it tolerates managements that destroy value at the margin.
The central analytical question is whether the de-rating is mispricing or repricing, and the honest answer is mostly repricing. Return on equity fell from 34.2% in FY2021 to 7.6% in FY2025. A business earning 7.6% on book does not deserve the ~1.5× multiple this stock carried at its ten-year median; on a 9–10% cost of equity, something in the range of 0.75–0.85× book is defensible. At 0.685× P/TBV the stock is genuinely below that — but the margin is a third, not the three-quarters that "cheapest in a decade" implies at first glance. Anyone underwriting a return to 1.5× book is underwriting an ROE recovery for which there is currently no evidence.
What makes it investable anyway is the downside. There is no lender. Twenty-one consecutive debt-free fiscal year-ends, a $100M revolver with nothing drawn, and $129.3M of cash and securities mean no covenant can be tripped, no maturity can be missed, and no refinancing window can close. Free cash flow was positive even in FY2025's trough, and the Q1 GAAP loss of $(0.21) came alongside positive $23.1M of operating cash flow — the loss was substantially non-cash. Two facts point the same direction: the CFO bought 31,000 shares of his own money at $16.13 in April, the only open-market purchase by any insider in twelve months, and the company resumed buybacks for the first time since FY2023.
The single most important risk is not leverage or governance — it is supplier concentration. Nike alone is 24% of net sales, the top three vendors 46%, and the company states plainly that it has no long-term contracts with any supplier. A single allocation decision by Nike would impair this thesis faster than any balance-sheet strength could absorb.
2. Business and Market Overview
Shoe Station Group is an omnichannel family footwear retailer operating 426 stores across 35 states and Puerto Rico under two banners: Shoe Carnival (282 stores, value and moderate-income families) and Shoe Station (144 stores, higher-income shoppers, broader assortment). It reports as a single operating segment. The company was founded in 1978, listed in 1993, and renamed itself in June 2026 to reflect Shoe Station as the intended long-term growth vehicle.
Revenue has declined in four of the last five years: $1,330.4M (FY2021) → $1,262.2M → $1,175.9M → $1,202.9M → $1,135.3M (FY2025), a 14.7% cumulative decline from the FY2021 peak. FY2025 net sales fell 5.6% on a 5.6% comparable-store decline, with the Shoe Carnival banner down 7.7% while Shoe Station grew 2.7% organically.
As of 2026-05-21, Q1 FY2026 net sales were $270.7M, down 2.5%, with the Shoe Carnival banner's comp decline improving to −2.2% from −7.7% — the first evidence of stabilization in the core banner.
The business is understandable, moderately cyclical, and structurally challenged rather than melting. Footwear retail is a discretionary category exposed to consumer credit conditions and to tariffs on imported goods. Capital intensity is moderate: FY2025 capex of $44.7M was 3.9% of sales, inflated by the abandoned conversion program; the maintenance run-rate is closer to the $33.2M of FY2024. The dominant structural pressure is vendor disintermediation — Nike, Skechers and Crocs all continue to expand direct-to-consumer channels that compete with their own wholesale customers.
Customer concentration is negligible (individual consumers). Supplier concentration is severe and is the defining commercial risk (see the risk matrix below).
3. Moat, Competitive Position, and Industry Cycle
Moat classification: WEAK.
Against a moat, and these dominate. Supplier concentration with zero contractual protection: three vendors are 46% of sales on no long-term contract (10-K Note 16). No pricing power — gross margin has sat in a 35–37% band for five years, and FY2025's 92bp improvement is attributed by management to pre-tariff inventory timing and mix, and is guided to reverse by roughly 260bp in FY2026. Demand is not sticky, with comps down 5.6%. And the rebanner failure is direct evidence against brand transferability: 101 conversions produced "significant variability in in-store performance" and were halted inside a year. A brand with real franchise value travels; this one did not travel reliably.
For a moat, real but limited. A 47-year operating history and a store fleet concentrated in mid-size markets where management describes Shoe Carnival as "the dominant family footwear retailer" — genuine local scale that is uneconomic for a competitor to replicate in a low-density trade area. Shoe Station is a working concept, growing organically and, per management, outperforming the industry for a third consecutive year. A CRM and loyalty asset with real penetration: Shoe Perks members were approximately 78% of comparable-store net sales in FY2025.
Not "None" — the local scale and Shoe Station evidence are real. Not "Narrow" — supplier concentration and the absence of pricing power cap it. A reasonable analyst could argue Declining, given the core banner's −7.7% comp and 18–24 planned closures.
Cycle position: below mid-cycle. Operating margin of 5.9% compares to a 15.6% peak in FY2021 and a pre-COVID FY2019 that was structurally lower still. The FY2021 peak was stimulus-inflated and is not a cycle mid-point.
Can it compound capital at attractive rates? Not currently. ROE is 7.6% and ROIC 11.7% on a 5-year basis. The most recent large capital deployment destroyed value.
4. Management, Governance, and Capital Allocation
As of 2026-02-24, CEO Mark J. Worden departed and resigned from the Board the same day, treated as a termination without cause. Clifton E. Sifford — Vice Chairman, and CEO from 2012 to 2021, covering the company's strongest years — was appointed Interim President and CEO. As of this report's date no permanent CEO has been named; the search has run approximately six months.
As of 2026-08-03, Tracy Dick was appointed Chief Marketing Officer, from PetSmart, Jack in the Box and Leslie's — evidence of bench rebuilding under the interim CEO.
Ownership. J. Wayne Weaver and Delores B. Weaver together hold 8,677,328 shares, 31.5%; all executive officers and directors as a group (nine persons) hold 33.6% (DEF 14A, as of 2026-03-31).
Compensation. Former CEO Worden's FY2025 total compensation was $4,058,347 (FY2024: $5,004,173) — 7.8% of FY2025 net income — including $2,795,577 of stock awards in a year with zero non-equity incentive payout. On departure he received $4.8M in cash plus 168,184 shares through accelerated vesting, generating a $5.3M charge and a $1.6M tax-deductibility penalty. Chairman Weaver received $400,018 for FY2025 board service.
Related-party transactions: clean. The DEF 14A states that during Fiscal 2025 there were no transactions exceeding $120,000 in which a related person had a direct or indirect material interest, and none are proposed. The Audit Committee must approve all related-person transactions and may not approve any unless terms are at least as favorable as those obtainable from an unrelated party.
Insider activity. The most decisive qualitative evidence in this report — all 24 Forms 4 filed in the trailing twelve months were parsed directly.
Insider activity
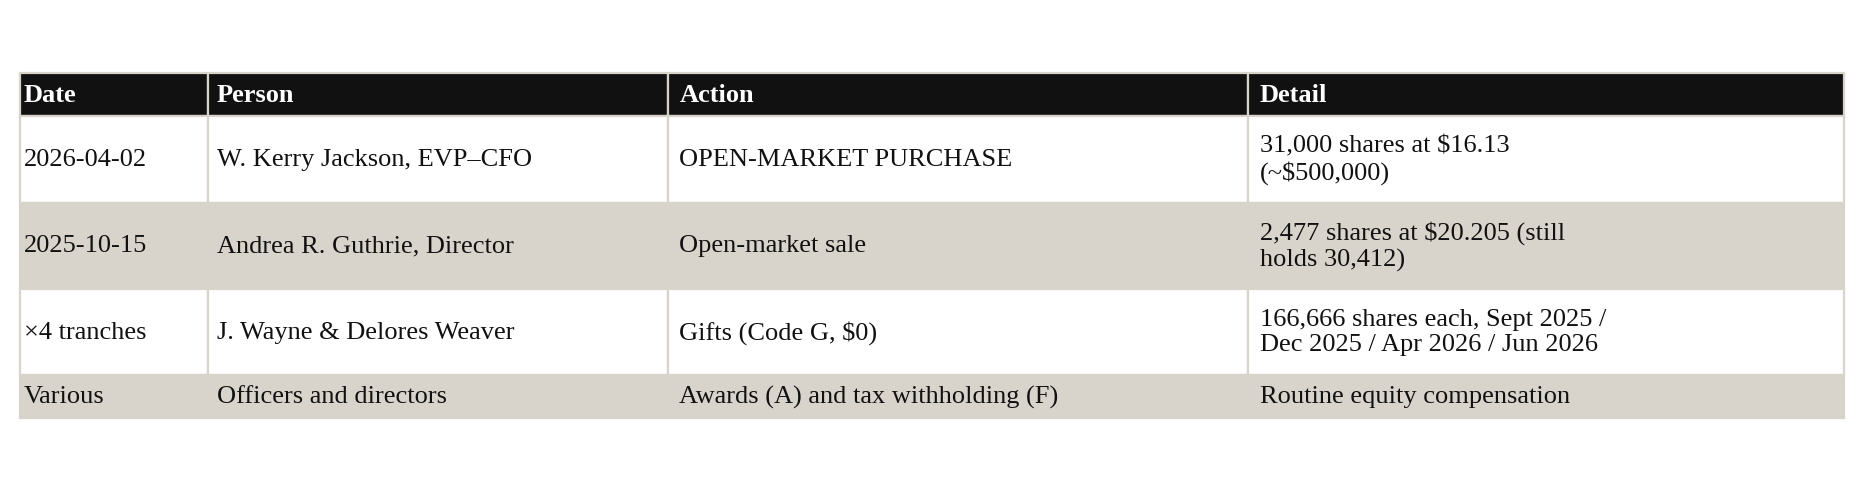
Three things matter here. The CFO's purchase is the only open-market buy by any insider in twelve months, and he made it after the CEO was terminated, after the rebanner strategy went under review, and after FY2026 guidance was cut — buying into disclosed bad news with his own money. There was exactly one open-market sale all year, of 2,477 shares. And the Weavers' large dispositions are Code G gifts at $0, not sales — their combined holding fell from ~9.33M to ~8.33M shares without a single share being sold into the market, a pattern consistent with programmatic charitable or estate transfers. Any data feed that codes these as insider selling reports roughly 667,000 shares sold and inverts the true signal.
Capital allocation — the core criticism. FY2025's conversion of 101 stores cost approximately $0.66 per share of earnings and drove capex up 35%. Within roughly twelve months the Q1 FY2026 10-Q recorded that the company "is no longer pursuing a single-banner Shoe Station strategy," that "only a limited number of additional Shoe Carnival locations meet the criteria for conversion," and booked $8.3M ($0.23/share) of store-level impairments and property write-offs, with 12–14 closures in FY2026 and 6–10 in FY2027.
Against that: the dividend has been raised for twelve consecutive years (56 consecutive quarterly payments), most recently +13.3% to $0.17/quarter in March 2026 — raised into a down year — and the company repurchased 390,492 shares for $7.0M in Q1 FY2026, its first buyback since FY2023, with $43M of authorization remaining.
Governance Risk: HIGH (two warnings identified in this review). This reads harsher than the facts warrant: there is a single share class with one vote per share, no dual-class structure, a majority-independent board, an independent Audit Committee with related-party approval authority, an explicit finding of zero material related-party transactions, and a controlling family giving stock away rather than extracting from the company. The genuine concerns are narrower: a classified board with three-year terms that entrenches, a strategy reversed at shareholder expense inside a year, and a severance package that richly rewarded its architect.
5. Corporate Ownership, Subsidiaries, and Joint Ventures
Ownership structure
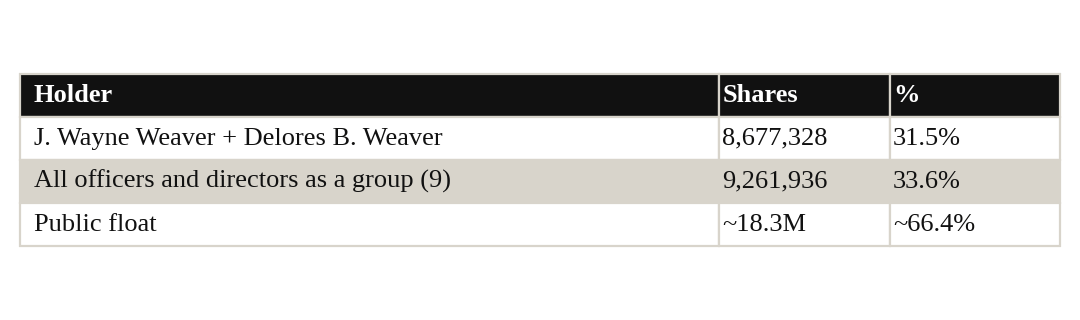
Single class of common stock, one vote per share. The company reports as one operating and reportable segment; no material joint ventures, minority interests, ring-fenced subsidiaries, upstream guarantees or intercompany pledges are disclosed. There is no holding-company structure separating creditors from operating assets. For a company of this size the structure is refreshingly simple, and none of the usual minority-leakage risks apply.
6. Historical Financial Quality and Normalized Owner Earnings
All figures $ thousands, from audited statements in the FY2025 10-K and the FY2024 10-K.
The ROE row is the most important line in this report. Returns fell from 34.2% to 7.6% in four years while book value grew 52%. The company retained and reinvested earnings into a business earning progressively less on capital. That is the mechanical explanation for the multiple compression discussed in the valuation section below, and it is why "cheapest P/TBV in a decade" is a weaker argument than it appears.
Normalized owner earnings. The cash-flow statements support a real, sourced free cash flow figure rather than a proxy: CFO $82.2M (10-year basis) less capex $49.8M gives normalized FCF of ~$32.4M. On the FY2023–FY2024 capex run-rate, normalized FCF would be closer to $50M. Against a $415.4M market cap that is a 7.8%–12.0% normalized FCF yield.
Normalized EPS — three bases, and a material caveat. Diluted EPS split-adjusted:
Annual diluted EPS history
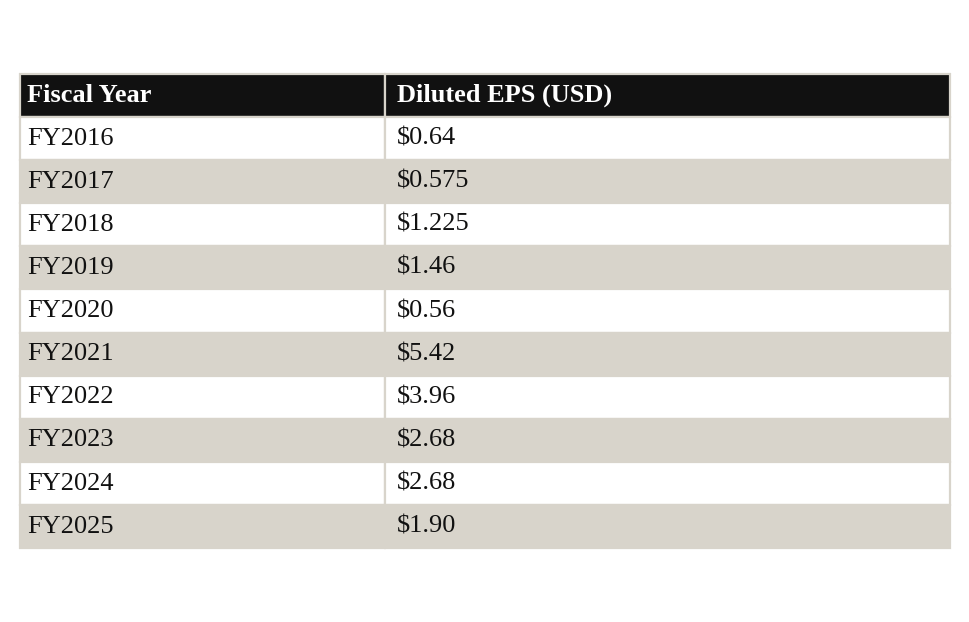
FY2016 EPS is not independently verified against a primary filing — the oldest 10-K retrieved for this report reaches only FY2017; FY2016's Diluted EPS of $0.64 is a reasonable substitution for a plain historical line item like this. One sanity check before use: $0.64 sits as a plausible continuation of the adjacent-year trend (FY2017 $0.575, FY2018 $1.225, neither an outlier) and of FY2016's own revenue ($1,001.1M) against FY2017's $1,019.2M — a smooth, unremarkable step, not a break. The split-adjustment basis also checks out: the FY2017 figure ($0.57) sits within rounding of the report's independently-derived $0.575, so $0.64 has had the same adjustment applied as the other nine years, not a different one.
Normalized EPS basis
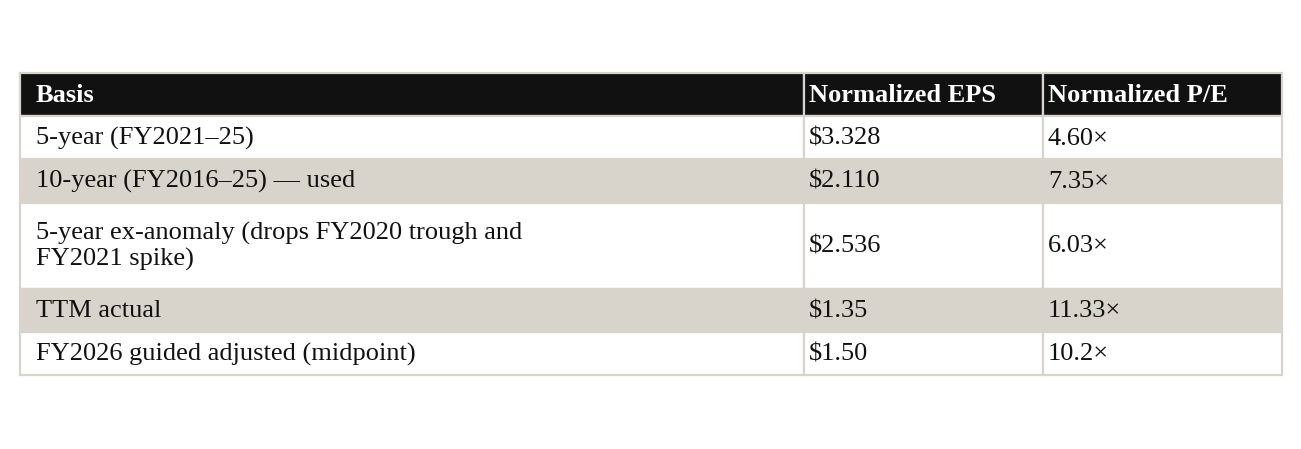
The 10-year average is used deliberately here, not the more common 5-year basis. A 5-year basis would label the earnings trajectory "Growing" simply because it compares the 5-year level against the 10-year level, and the stimulus-inflated FY2021 sits at the start of that 5-year window. Within that same window EPS actually fell from $5.42 to $1.90. A 5-year basis inflates normalized EPS by roughly 58% against the 10-year figure and is not a like-for-like read on current earning power. Every basis considered here, trailing, forward, and all three normalization methods, lands in the same cheap range regardless, so this choice does not change the verdict.
6.5 Piotroski F-Score — 5 / 9
FY2025 vs FY2024, ROA and asset turnover on beginning-of-year assets.
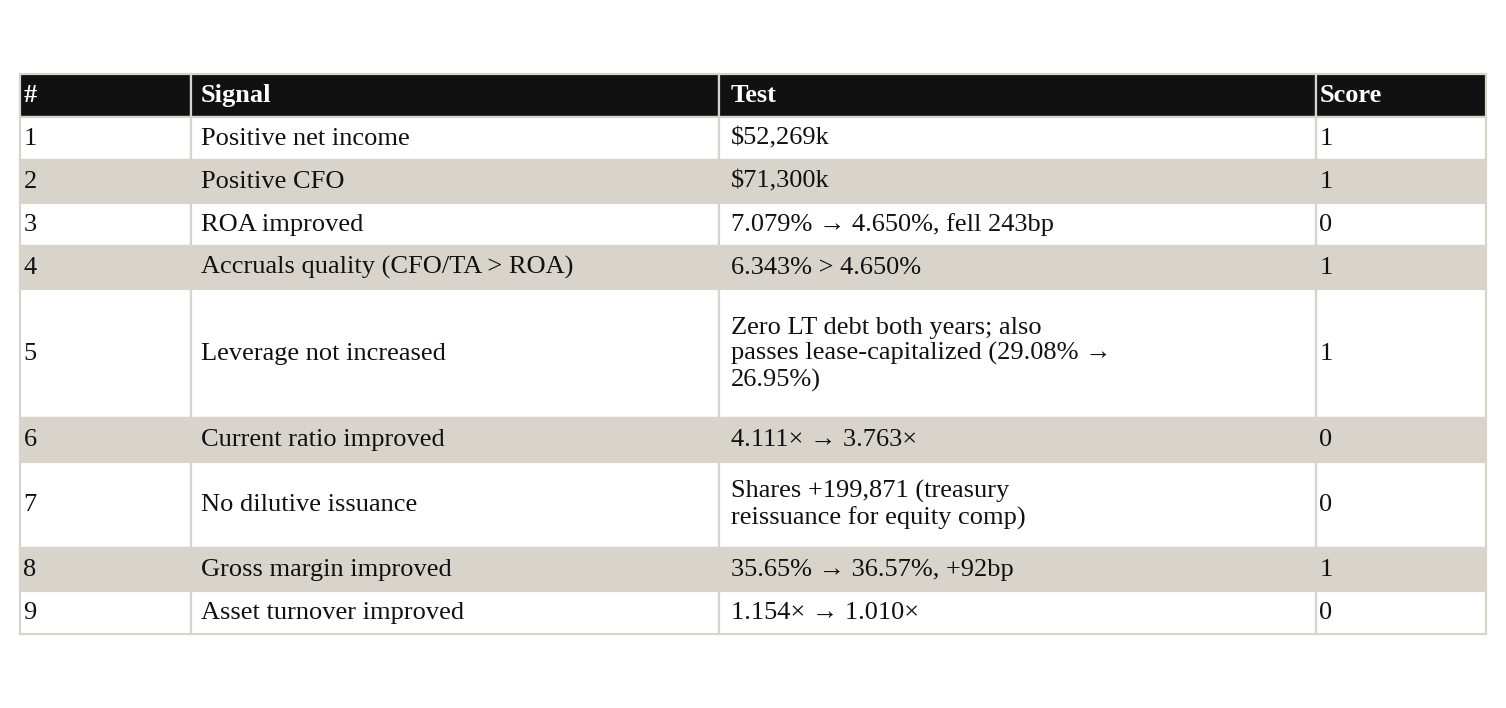
Total 5/9 — Eligible (4–9 band). Two disclosures: signal 7 is scored strictly at 0, though the increase is entirely treasury reissuance for vested stock compensation with issued shares constant at 41,049,190 and weighted-average diluted shares essentially flat — a lenient reading gives 6/9. And signals 3, 6 and 9 all failed for one underlying reason: the balance sheet grew (inventory +14%, capex +35%) while sales and earnings fell. That is a genuine negative, not an artifact.
Note: with zero long-term debt in both fiscal years, leverage did not increase, so the leverage signal passes.
7. Balance Sheet, Debt, Covenants, and Refinancing Risk
Classification: NET CASH — the strongest balance-sheet category this report tracks.
Capital structure and liquidity
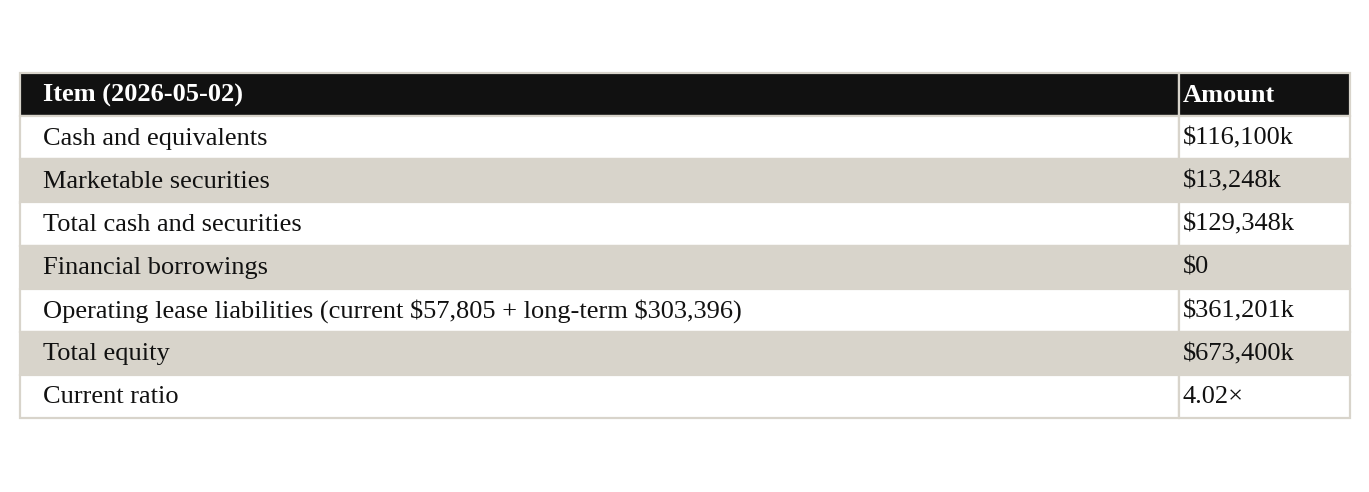
There is no debt line of any kind on the balance sheet. The liability section runs accounts payable → accrued and other → current portion of operating lease liabilities → long-term portion of operating lease liabilities → deferred income taxes → deferred compensation → other. No notes payable, no long-term debt, no current maturities, no finance-lease liability.
10-K Note 10 confirms a $100M amended and restated revolving credit facility expiring 2027-03-23, inventory-collateralized: "No borrowings were outstanding under the Credit Agreement as of January 31, 2026 or February 1, 2025, and we did not borrow under the Credit Agreement during Fiscal 2025 or Fiscal 2024." At year-end, $1.0M of letters of credit were outstanding with $99.0M available. FY2025 was the 21st consecutive debt-free fiscal year-end. Covenants: minimum net worth $250M against actual equity of $689.7M (a 2.8× cushion), consolidated interest coverage ≥3.0×, and a $20M cap on additional debt.
The lease-versus-debt distinction, stated explicitly. The $371.4M of operating lease liabilities is not borrowed money. It is the discounted present value of contractual store rent, brought on-balance-sheet only in 2019 under ASC 842, offset by a $349.6M right-of-use asset. It carries no financial covenants, no acceleration clause tied to leverage, no refinancing wall, and no lender able to call it. Under the Schloss debt filter this report uses financial borrowings — $0, or 0.0% of equity — while also reporting the lease-inclusive construction at 53.6%. Both pass the ≤100%-of-equity test with room. Any data feed showing ~$371M of "total debt" for this company is capitalizing leases; the honest formulation is zero borrowed money and substantial contractual rent.
That said, the rent is real and non-cancellable: $371M of obligations against a $415M market cap, and closing an underperforming store does not extinguish its lease. The 18–24 planned closures will carry exit costs.
Refinancing risk: none. There is nothing to refinance. Interest coverage is 164× — a figure that only makes sense once you understand there is no interest-bearing debt.
8. Real Estate, Leases, and Hidden Assets
The company leases essentially all 426 stores; it is not a property owner. Right-of-use assets are $349.6M against $371.4M of lease liabilities — the small excess of liability over asset is normal amortization timing.
One caveat that matters to the valuation, and it cuts against the thesis. Tangible book value of $614.5M includes that $349.6M of right-of-use assets — 57% of the total. An ROU asset is not realizable in a liquidation the way inventory, cash or owned real estate is; it is the capitalized right to occupy space the company must also pay for. Tangible book value should therefore not be read as a liquidation floor. The genuine downside support is the $129.3M of net cash plus inventory, not the full TBV figure. This distinction is not made by standard screens, and it materially qualifies the asset-value case.
No material hidden assets, sale-leaseback optionality or under-marked property are identified.
9. Capital Markets Access, Dilution, and Financing Flexibility
The company does not rely on capital markets to fund operations and has not issued equity for capital. FY2025 cash proceeds from stock issuance were $172k, entirely employee stock purchase plan. Shares outstanding rose 199,871 (0.7%) via treasury reissuance for vested compensation; weighted-average diluted shares were essentially flat at 27,524k → 27,535k.
Financing flexibility is excellent and entirely unused: $99.0M available on the revolver, $129.3M of cash and securities, and $43M remaining on the buyback authorization. Dilution risk is minimal and limited to ongoing equity compensation.
10. Litigation, Regulatory, and Contingent Liability Risk
No material litigation is disclosed. 10-K Note 16, verbatim: "From time to time, we are involved in certain legal proceedings in the ordinary course of conducting our business. While the outcome of any legal proceeding is uncertain, we do not currently expect that any such proceedings will have a material adverse effect on our consolidated balance sheets, statements of income, or cash flows." There is no separate commitments-and-contingencies note carrying loss accruals and no litigation reserve on the balance sheet.
Tariffs are the live regulatory exposure and are explicitly unquantified. In February 2026 the US Supreme Court struck down certain IEEPA tariffs and the executive branch reimposed tariffs under other statutes. 10-K Note 17 states there is "considerable uncertainty regarding the scope and duration of current and potential tariffs... including availability and timing of refunds of tariffs paid under IEEPA," and that the company "cannot reasonably estimate the total financial impact." This cuts both ways: potential IEEPA refunds are an unpriced call option, while renewed tariffs are a cost headwind already embedded in the guided 260bp gross-margin decline.
11. Accounting Quality and Disclosure Review
Classification: HIGH.
Unqualified audit opinion, no going-concern language, no material weaknesses, no restatements in the lookback period. Segment reporting is simple (one segment). Related-party disclosure is explicit and clean. Revenue recognition is straightforward point-of-sale retail. There are no pension assumptions of consequence and no aggressive capitalization policies identified.
Non-GAAP usage is present but appropriately reconciled and not misleading: Q1 FY2026 adjusted SG&A excludes $13.6M of non-recurring charges from the CEO transition and the strategic review, and the company reports both GAAP EPS of $(0.21) and adjusted EPS of $0.23 side by side. The adjustments are genuinely non-recurring in character.
Two items warrant attention rather than concern. The Q1 FY2026 effective tax rate of (11.2)% versus 28.1% a year earlier is a benefit that flatters the reported loss — the pre-tax result is worse than the after-tax figure suggests. And goodwill of $18.0M plus intangibles of $40.9M arising from the Shoe Station acquisition sit on the balance sheet while the strategy built around that brand has just been curtailed; the FY2025 impairments were taken against store-level long-lived assets, not against the brand intangible. That is defensible — the Shoe Station banner is growing — but it is the asset most exposed to a further write-down if the concept stalls.
12. Valuation and Margin of Safety
Current price $15.50 (2026-08-17 close, the day the position was initiated) · 27,151,308 shares · market cap ~$417M.
Tangible book value — filing-derived bridge
TBV/share is shown and proven from the filing bridge below, not asserted:
Equity (2026-05-02, 10-Q)          $673,400k
less Goodwill                       (18,018k)
less Intangibles (ex-goodwill)      (40,911k)
= Tangible Book Value               $614,471k
TBV/share = 614,471 / 27,151,308 = $22.6314
P/TBV = 15.50 / 22.6314 = 0.6849x
Net cash of $129.3M = $4.76/share = 31.1% of the share price. Enterprise value is $286.1M, putting EV/EBIT at 4.29× on FY2025 operating income (unchanged — EBIT and net cash are filing-based, not price-dependent).
Historical Relative Multiple Valuation
From the company's ten-year trading history — 41 quarterly P/TBV observations, 2016-04 to 2026-04, and 40 P/E observations over the same window.
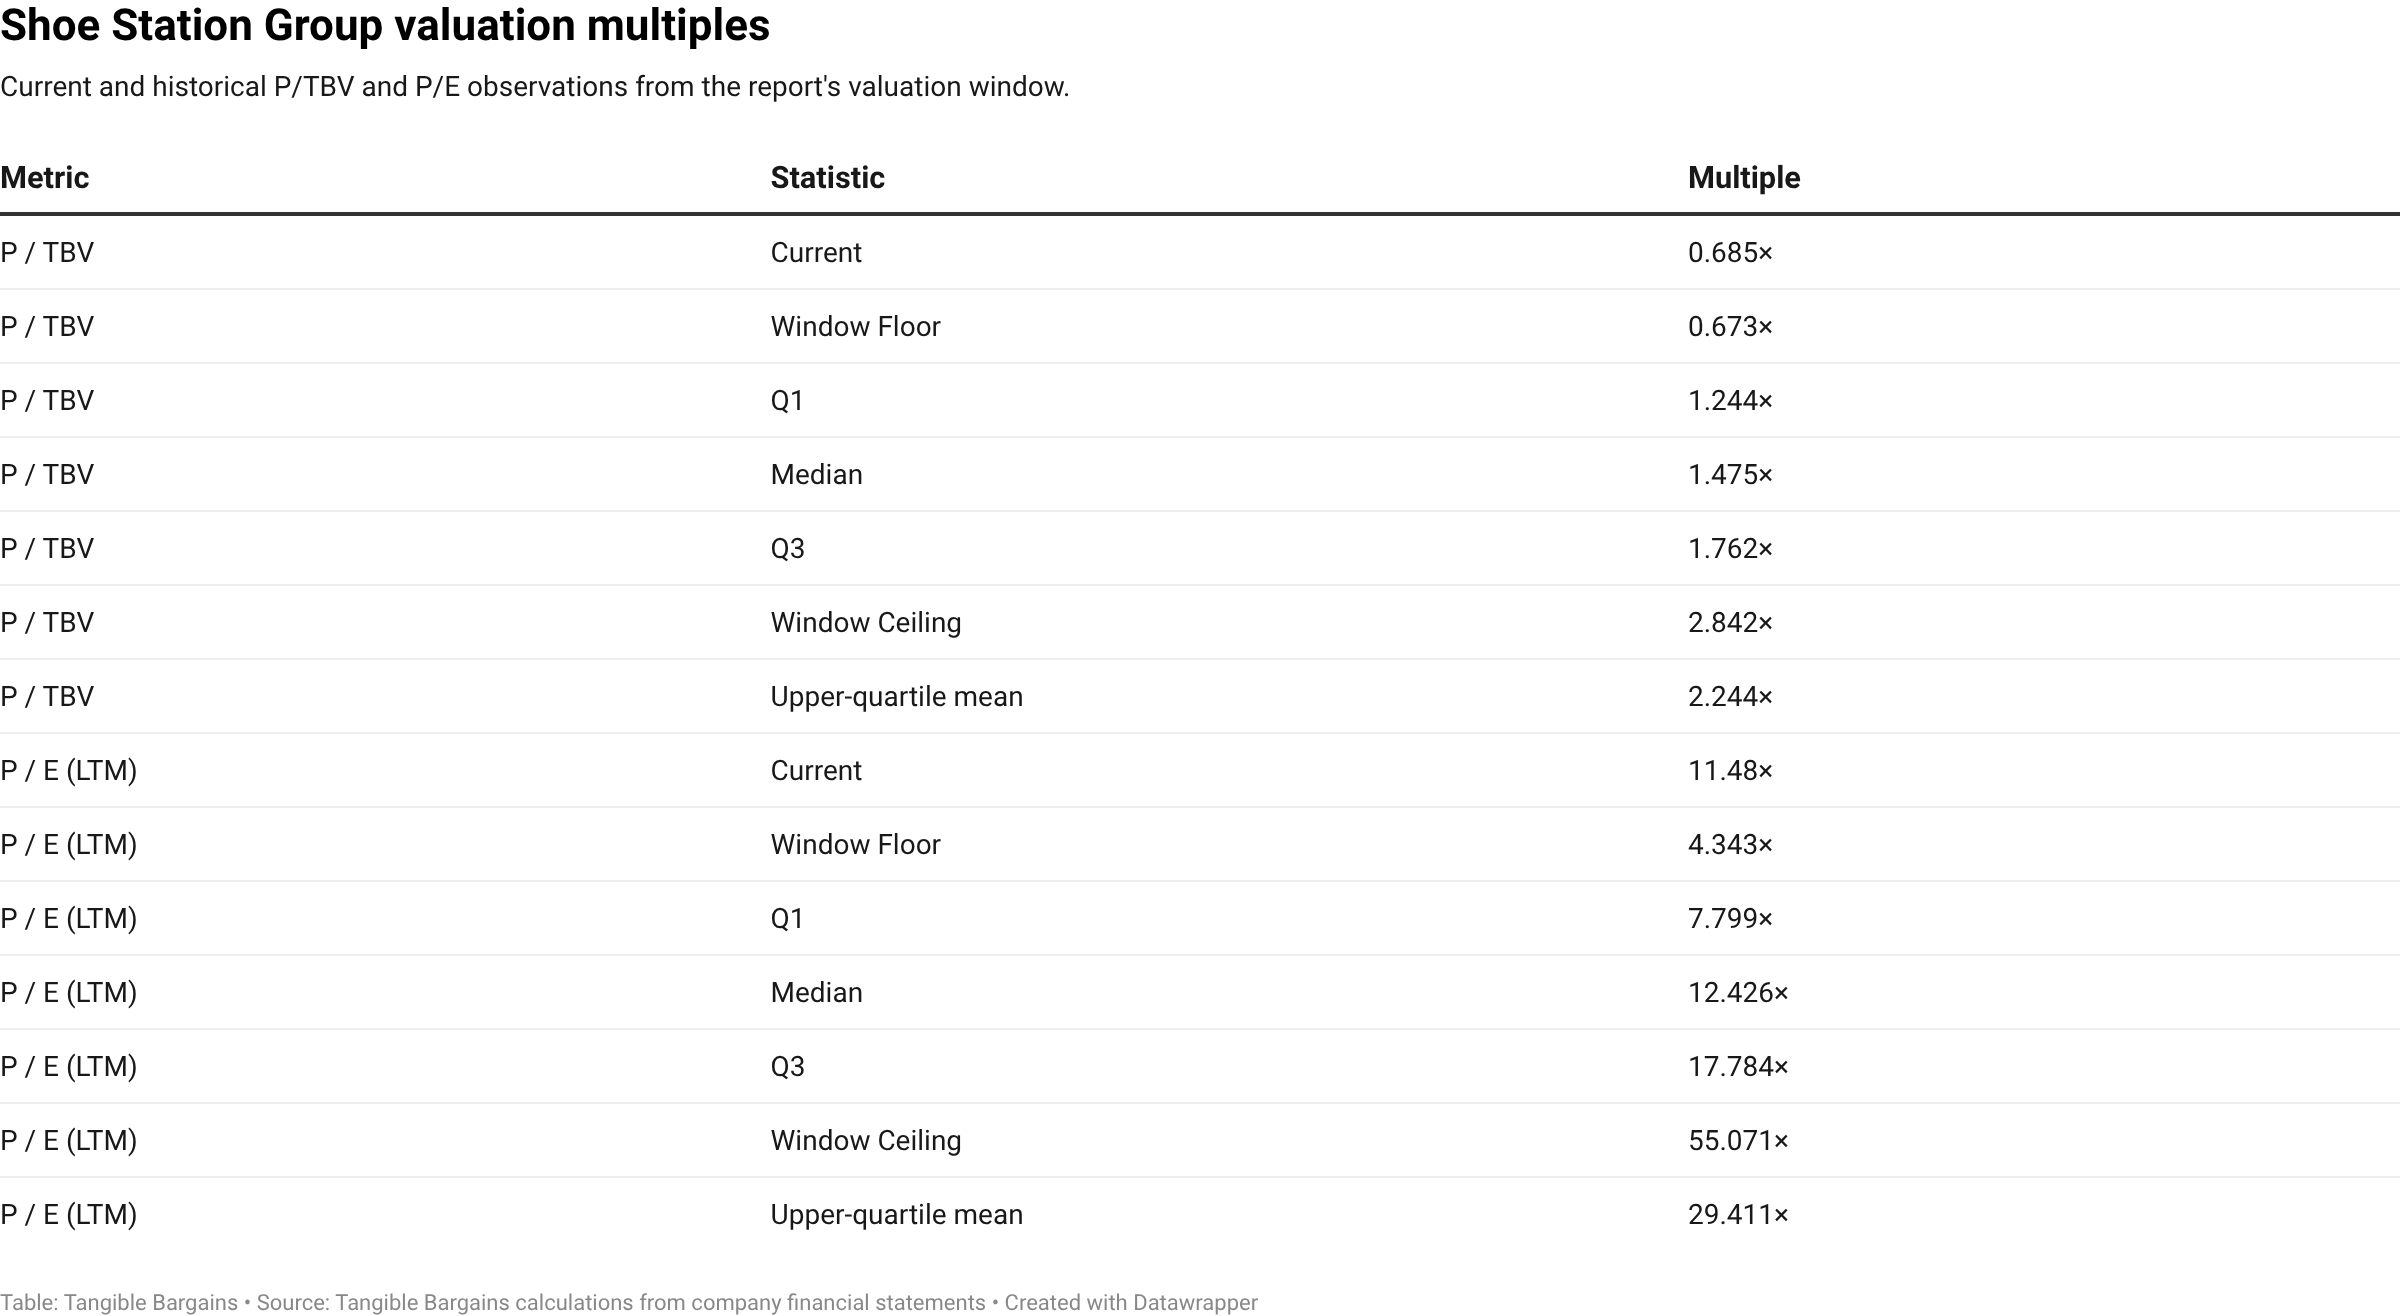
(Distribution columns — Window Floor/Q1/Median/Q3/Window Ceiling/Upper-quartile mean — are the same 41-observation trading-history window as at original publication, 2016-04 to 2026-04; no new quarter has printed. Only the "Current" column moves, with the 2026-08-17 close.)
Recent P/TBV trajectory: 2.13 → 1.66 → 1.28 → 0.82 → 0.94 → 0.82 → 0.84 → 0.67.
The current P/TBV of 0.685× sits just above the ten-year window floor of 0.673× (the April 2026 observation) — the stock has traded fractionally cheaper only once in the available ten-year history, and today's reading sits 54% below its ten-year median.
The two legs diverge sharply, and the reason is the whole analysis. On P/TBV the stock is near an all-time low; on P/E it is at 11.48× against a 12.43× median — only modestly cheap. The divergence is not noise: earnings collapsed while book value grew. TBV per share rose $19.86 → $21.71 → $23.04 across FY2023–FY2025 while EPS fell $2.68 → $1.90. A P/E computed on depressed earnings looks unremarkable; a P/TBV computed against a rising book looks extreme. The book-value leg is doing the work, and it is doing it because the market has repriced the return on that book, not merely the book.
This is why the historical band cannot be used as a price target. Multiplying TBV by the 1.244×–1.762× typical band implies $28–$40 per share. That band was earned by a business generating 20–34% ROE. At FY2025's 7.6% ROE and a 9–10% cost of equity, a defensible multiple is roughly 0.75×–0.85× book, implying $17–$19. Reversion to the historical band requires an ROE recovery for which there is currently no evidence, and underwriting it would be assuming the conclusion.
Intrinsic value — four anchors
Intrinsic-value anchors
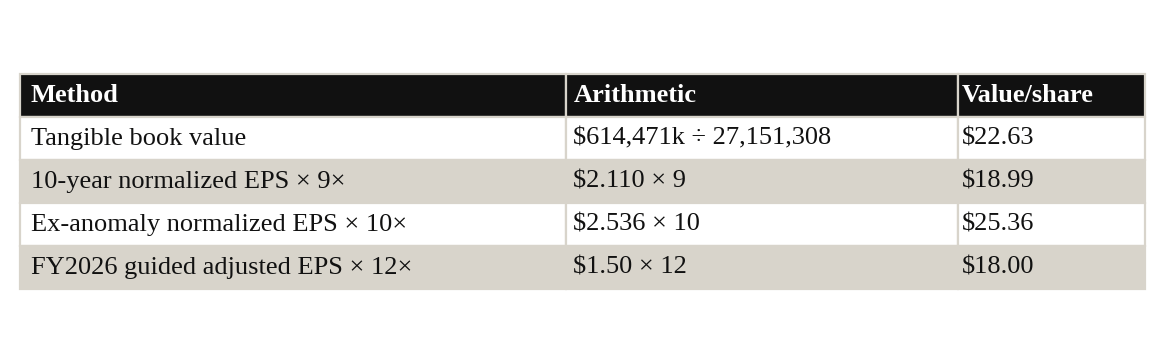
Illustrative anchor range (analyst cross-check, not the Sell Range): $18 – $25, central ~$21 (≈0.94× tangible book). These four anchors are static — TBV, the 10-year normalized EPS, and FY2026 guidance are all filing/guidance-based, not price-dependent. This range is informational only. The Sell Range below, not this range, is what governs.
Scenario table
Severe downside — $11.32/share: Nike relationship impaired, comps −10%, and ROE falls toward −4%.
Bear — $15.50/share: FY2026 guidance missed and margin falls below 34%; no re-rating.
Base — $18.11/share: FY2026 delivered at $1.50 and ROE stabilizes around 7–9%.
Bull — $24.89/share: A permanent CEO is installed, ROE recovers toward 12%, and closures complete.
Sell Range
Sell Range = [median P/TBV, top-quartile-mean P/TBV] × current TBV/share, derived from the same 41-observation distribution above:
Low = median 1.475× × $22.6314 = $33.38 → $33
High = top-quartile mean 2.244× × $22.6314 = $50.79 → $50
Sell Range: $33 – $50 (1.48× – 2.20× TBV), 41 observations so not data-limited.
Buy-Below: 0.80× TBV = 0.80 × $22.6314 = $18.11. This is an entry guide, not the Sell Range above: it marks the price below which the shares are cheap enough to warrant a larger position, not a price to sell at.
Buy More Below: $14.71 (0.65× TBV). Two capital-allocation red flags are noted separately — concentrated family and board control, and the capital sunk into the failed re-banner program — and are a matter for judgment alongside the price, not folded into it.
Valuation summary
Current price: $15.50
Illustrative anchor range: $18–$25, central ~$21
Sell Range: $33–$50 (1.48×–2.20× TBV)
Buy-Below: $18.11 (0.80× TBV)
Buy More Below: $14.71 (0.65× TBV)
Cheapness type: Asset-value cheap, with genuine value-trap risk
The cheapness is real but its character matters: this is not a high-quality compounder on sale, and it is not a pure statistical bargain either. It is an asset-value situation with a fortress balance sheet and a deteriorating earnings stream, backed by net cash and tangible assets rather than franchise quality or earnings power.
13. Risk Matrix
Risk matrix
Critical — Supplier concentration: Nike is 24% of sales and the top three suppliers are 46%, with no long-term contracts. Monitor vendor commentary and DTC expansion.
High — Continued earnings decline: Operating margin fell from 15.6% to 5.9% and ROE from 34.2% to 7.6%. Monitor quarterly comps and gross margin against the 34% guide.
High — No permanent CEO: The company has been operating with an interim CEO since 2026-02-24. Monitor the appointment announcement.
High — Gross margin guide: FY2026 guidance is roughly 34% versus 36.6% previously. Monitor the Q2 report, expected in early September.
Medium — Tariffs: The 10-K says the impact cannot reasonably be estimated. Monitor trade rulings.
Medium — Further store impairments: $8.3M has been taken and 18–24 closures are planned. Monitor closure cadence.
Medium — Shoe Station intangible write-down: $18.0M of goodwill and $40.9M of intangibles remain tied to the curtailed strategy. Monitor the annual impairment test.
Medium — Governance entrenchment: A 31.5% block and classified board limit outside influence. Monitor proxy proposals.
Medium — ROU assets overstate liquidation value: $349.6M of $614.5M in tangible book is right-of-use assets.
14. Red Flags, Yellow Flags, and Green Flags
🟢 Green Flags
Zero financial borrowings; 21 consecutive debt-free fiscal year-ends
$129.3M net cash — 31% of market cap; current ratio 4.02×
CFO bought 31,000 shares (~$500k) at $16.13 in April 2026, after the bad news
12th consecutive annual dividend increase, +13.3%, raised into a down year
Buybacks resumed — 390,492 shares for $7.0M, first since FY2023, $43M remaining
Positive operating cash flow ($23.1M) despite a Q1 GAAP loss — the loss is substantially non-cash
Zero material related-party transactions; single share class
Cheapest P/TBV in the ten-year record
Shoe Perks loyalty ≈ 78% of comparable-store sales
🟡 Yellow Flags
Revenue down four of five years; −14.7% from the FY2021 peak
Piotroski 5/9 — the four failures are all deterioration signals
FY2026 gross margin guided down ~260bp
Q1 tax benefit of (11.2)% flatters the reported loss
$18.0M goodwill + $40.9M intangibles tied to a curtailed strategy
57% of tangible book is right-of-use assets, not liquidation-realizable
Classified board entrenches a 31.5% holder
Most recent hard financials are 3.5 months old; Q2 unreported
🔴 Red Flags
Nike = 24% of sales, top three = 46%, on no long-term contracts
ROE collapsed 34.2% → 7.6% in four years
Capital allocation failure: 101 conversions, ~$0.66/share cost, written down and abandoned within twelve months
$4.8M severance plus accelerated stock to the CEO who authored the abandoned strategy
No permanent CEO six months into an interim arrangement
Operating margin down nearly two-thirds from FY2021
⚡ Must-Watch Catalysts
Q2 FY2026 results, due early September 2026 — first read since guidance was reaffirmed
Permanent CEO appointment
Gross margin against the ~34% FY2026 guide
Execution of the remaining $43M buyback at sub-book prices
Store-closure count versus the guided 18–24
Any change in Nike allocation or terms
Tariff rulings and potential IEEPA refunds
Further insider open-market purchases
FINAL VALUE-INVESTING RECOMMENDATION
Verdict: BUY — STANDARD
Recommendation summary
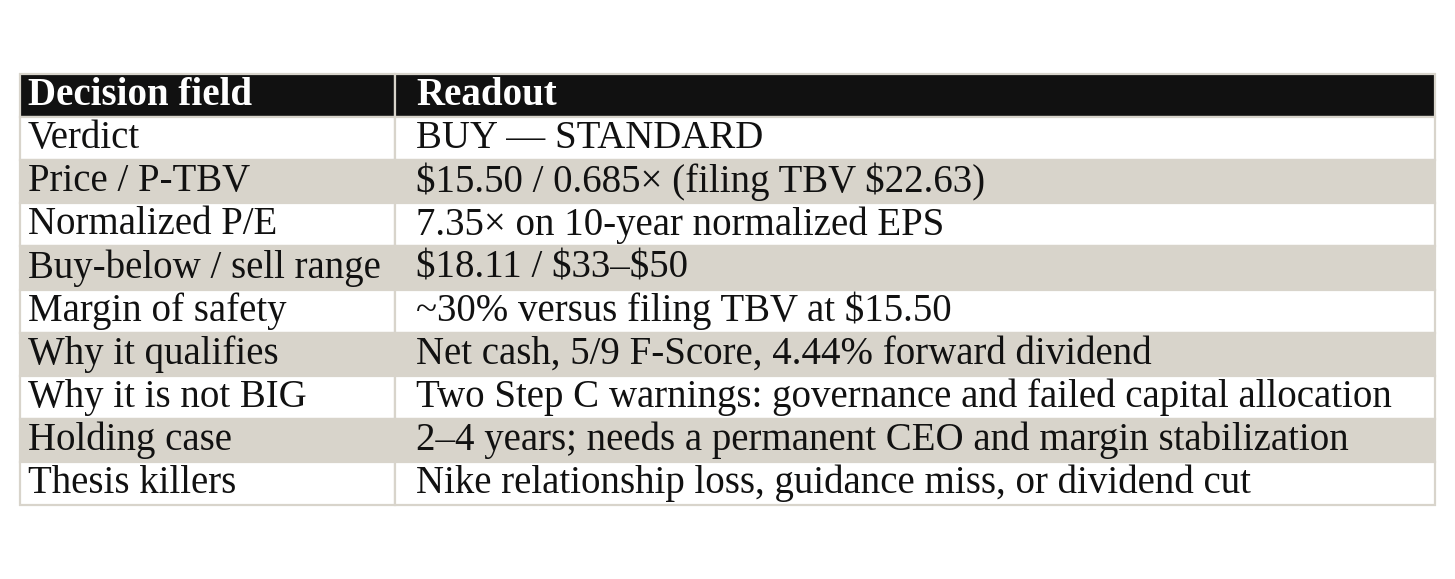
Why it may work
The stock is cheap against filing tangible book and normalized earnings, with net cash and a meaningful shareholder return.
The house buy-below is $18.11; the illustrative sell range is $33–$50 if the valuation normalizes.
The upside case is mean reversion, not a heroic earnings-growth forecast.
What keeps it at STANDARD
Two warnings fired: concentrated control/classified governance and the failed rebanner capital-allocation program.
Operating performance has deteriorated, supplier concentration is material, and the company still lacks a permanent CEO.
The balance sheet limits some downside, but tangible book is not the same as liquidation value because leases, inventory, and intangibles matter.
What would change the verdict
Q2 FY2026 results and gross margin against the roughly 34% guide.
A permanent CEO appointment and evidence of better capital allocation.
Buyback execution, store closures, Nike terms, inventory, dividend policy, and any revolver draw.
VALUE INVESTOR MUST-WATCH LIST
Q2 FY2026 results and gross margin against the guided ~34%.
Permanent CEO appointment and that person's capital-allocation record.
Buyback execution, store closures, inventory, and Shoe Carnival/Shoe Station comps.
Nike, Skechers, and Crocs allocation, terms, and DTC expansion.
Dividend declarations, tariff rulings, and any revolver draw.
Goodwill and Shoe Station intangible impairment testing at year-end.
SOURCES AND DILIGENCE GAP LOG
Sources accessed
SEC EDGAR: FY2025 10-K, Q1 FY2026 10-Q, DEF 14A, FY2025 results 8-K, 24 Forms 4, and historical 10-Ks.
Business Wire: Name/ticker change announcement dated 2026-06-11.
Market-data cross-check: Price, market cap, and 52-week range retrieved 2026-08-16.
Derived calculations: TBV bridge, current P/TBV, and the 41-observation historical P/TBV distribution.
Data quality: EXCELLENT.
Diligence gaps
Q2 FY2026 results: Not yet filed; most recent hard financials are 3.5 months old; expected early September.
Permanent CEO: Identity and search timeline not disclosed.
FY2026 capex guidance: Not guided; Q1 actual was $10.4M.
Tariff impact: Issuer says it cannot be estimated.
FY2016 EPS: Resolved from a secondary historical line item; oldest retrieved 10-K reaches FY2017, so this figure is not independently filing-verified.
Q1 buyback average price: Estimated from secondary commentary; aggregate $7,002k is confirmed in the cash flow statement.
TBV/share basis: Filing-derived Q1 FY2026 10-Q bridge governs at $22.63/share; a secondary dataset used a different period/basis.
Piotroski signal 7: Judgment disclosed; strict score 5/9, lenient reading 6/9.
Normalized-EPS basis: Judgment disclosed; the 10-year basis is used deliberately. Overall Data Quality Rating: EXCELLENT
Both the annual (10-K, FY ended 2026-01-31) and interim (10-Q, quarter ended 2026-05-02) filings were directly fetched and read from SEC EDGAR — not summaries — along with the DEF 14A, the 8-K earnings exhibit, four earlier 10-Ks, and the complete XML of all 24 trailing-twelve-month Forms 4. The litigation, debt and related-party notes were each located and read in the actual filing. Aggregators were used only for the live share price, cross-checked across two sources and validated against an independently computed TTM EPS.
Research only, not investment advice. Long, ~0.5% of portfolio (initiated 2026-08-17, 33 shares, average fill $15.49 — a cent below the $15.50 close used throughout this report's valuation math).